
Temperature and cold chain monitoring
Temperature and cold chain monitoring from GPS.az shows what is happening inside the body of a refrigerated unit right now and what happened over the whole run. Sensors record temperature, humidity and door openings, the system warns you when the load goes outside its allowed range, and once the delivery is done you are left with a report that proves the carriage conditions to a customer or an auditor.
From the data on board to the dispatcher's decision
Sensors
BLE temperature and humidity sensors in the cargo area, a reed switch on the door of the refrigerated unit.
Tracker
Collects the sensor readings and sends them together with the coordinates and the state of the door.
Wialon
Compares the temperature with the range for the load and filters out short spikes with a delay.
Notification and report
The logistician learns about the problem en route, the customer receives a temperature report for the run.
Features and tools
Sensors
- Continuous temperature and humidity monitoring in the cargo compartment
- Wireless BLE Eye sensors for straightforward fitting
- Cargo compartment door openings tracked in real time
- Integration with refrigerated units for remote control
Response
Reporting
- Detailed temperature records and reports (GDP/HACCP)
- Proof of carriage conditions for audits and customers
- Temperature history for analysis and logistics optimisation
A hot day in the life of one refrigerated unit
An illustrative example: a dairy delivery round across Baku and Absheron in July, range +2…+6 °C.
- Leaves the depot, body pre-cooled +3 °C
The pre-cooling shows up on the graph: the load went into a cold body rather than a warm one.
- Door held open for 6 minutes at a drop +9 °C
The notification delay filters out short openings. Here the door was held open for a long time, so the logistician rings the driver.
- Temperature back within range +4 °C
The event is closed, but it stays in the log of the run with its time and place.
- Fridge unit switched off at a stop +10 °C
The driver shut the engine down in the heat outside a shop in Sumgait. The notification arrives while the load can still be saved.
- Temperature report for the run sent to the customer PDF
A graph and a table at 10-minute intervals, deviations and door openings — all in one document.
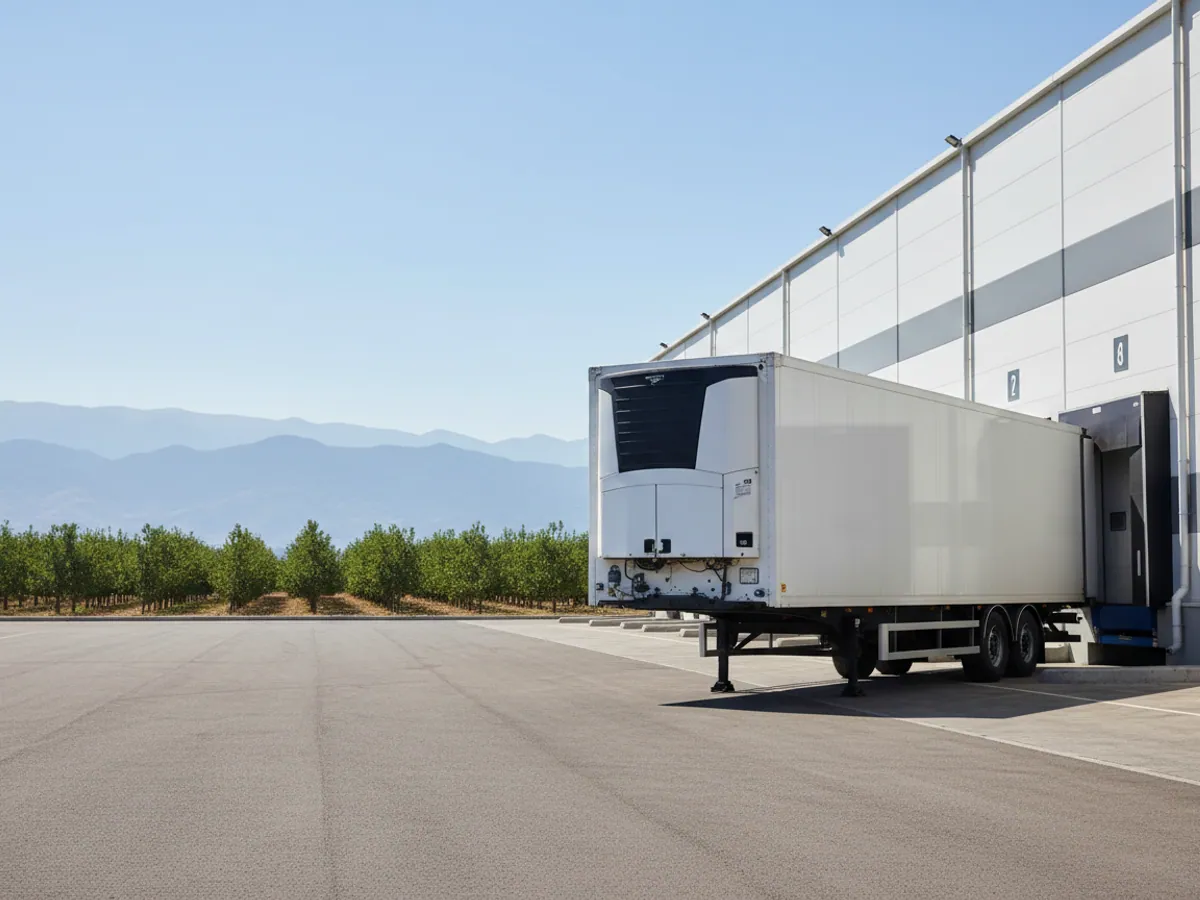
July, +41 °C, twenty delivery drops
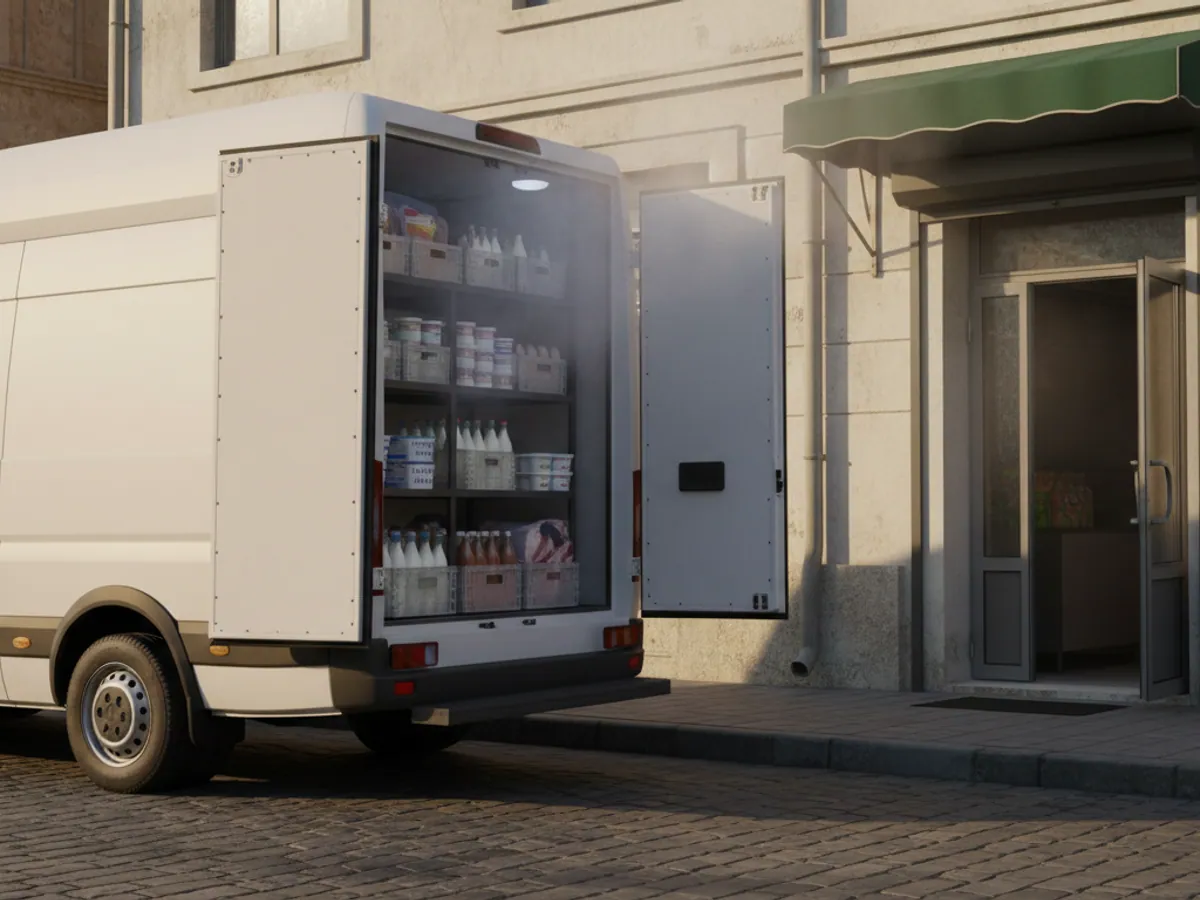
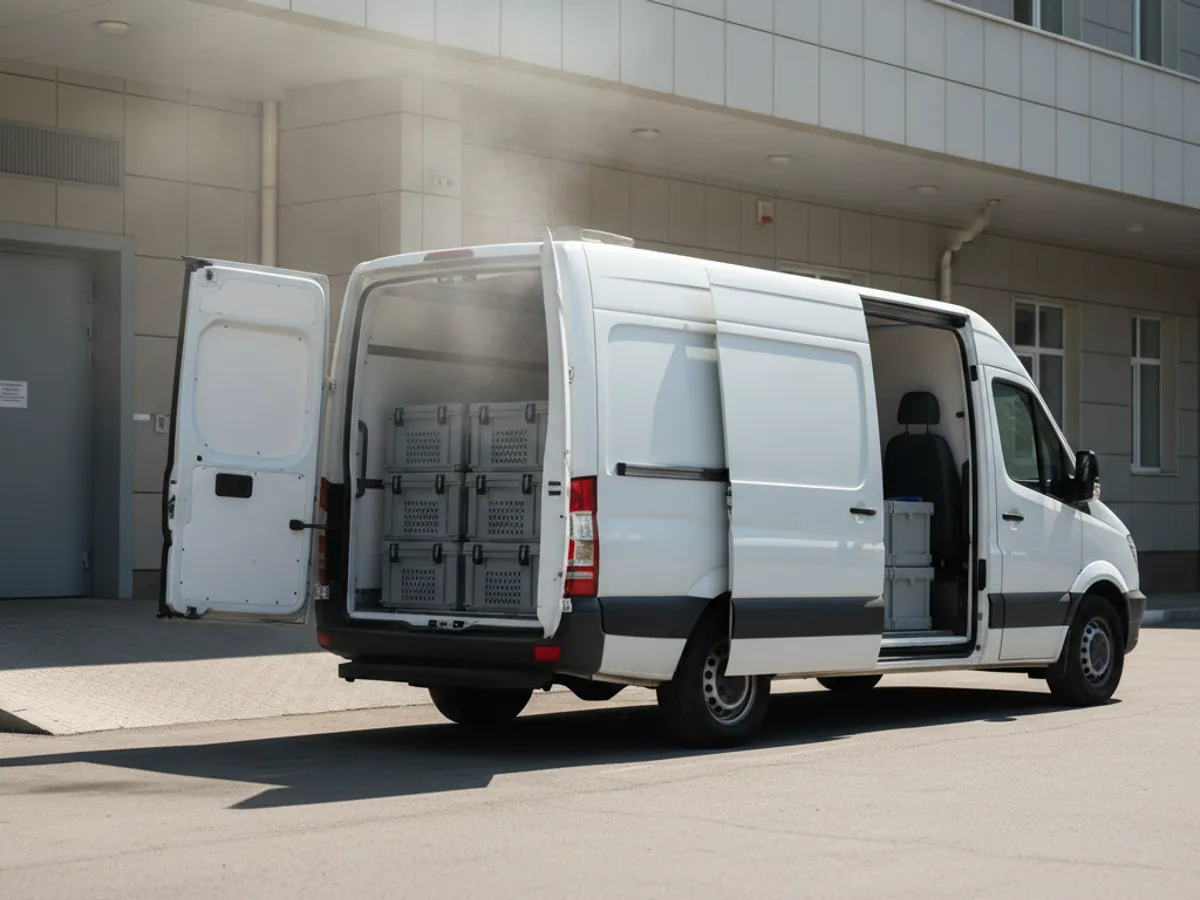
An insulated van loaded with dairy products leaves the depot in Absheron at six in the morning. The setting is +2…+6 °C. Everything is fine in the morning, but by midday the driver is leaving the rear door open at every drop while he carries the crates in — it is quicker that way. By the twelfth drop the temperature in the body is already +9 °C, and the fridge unit cannot pull it back down between stops.
Without sensors none of this comes to light until the shop sends back a pallet of soured yoghurt. With a temperature sensor and a door sensor the logistician sees the problem at the moment it starts: the door has been open for more than three minutes and the temperature is climbing. A notification in Telegram, a call to the driver, the door is shut.
After the shift you are left with a temperature graph for the whole run, marked with every door opening. It shows which drops the driver kept the body open at, and how long the unit then needed to bring the setting back. That is a concrete conversation with the driver rather than a vague instruction to keep an eye on the temperature.
In summer on the roads of Azerbaijan these stories happen constantly: heat outside, frequent stops, ageing units on second-hand vans. The cold chain breaks not on the open road but at the unloading point.
Different loads, different monitoring requirements
Pharmaceuticals and vaccines
The strictest requirements of all. Typical ranges are +2…+8 °C and +15…+25 °C, and going outside them even briefly can mean writing off the consignment. Here you need a sensor in every temperature zone of the body, frequent logging and a report that shows every point without smoothing.
Pharmaceutical distributors usually also ask for evidence that the sensor is checked regularly. We advise keeping a certified reference thermometer and comparing the sensors against it once a season. There is more about the sector on the page for pharmacy chains.

Sensors and refrigerated units: what connects to what
There are three sources of temperature data, and they are often combined.
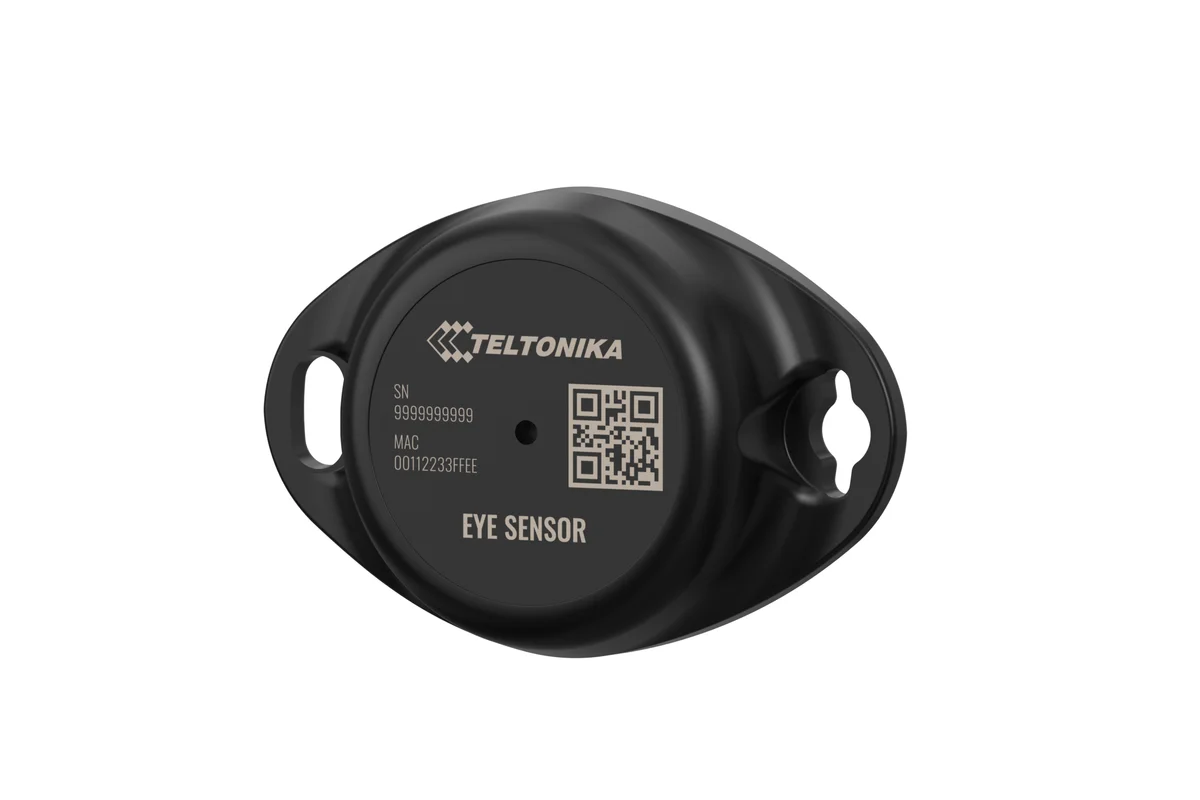
- Wireless EYE Sensors. They mount inside the body without drilling the walls and send temperature and humidity to the tracker over Bluetooth. Convenient when the van is on hire or the insulation must not be broken. The specifications are in the Teltonika EYE Sensor product page.
- Wired digital sensors. They connect to the tracker by cable and need no battery. A good fit for freezer bodies and for fleets that would rather not keep track of battery changes.
- Data from the refrigeration unit itself. Some Thermo King and Carrier units have an interface through which the tracker can read the set point, the return air temperature and the alarms. It does not work with every model and it needs a compatible tracker.
About remote control of the refrigeration unit we will be straight with you. Reading the data is realistic on many models. Changing the set point or starting the unit remotely works only on certain models with the relevant support, and it has to be checked on the particular vehicle. We do not promise it in advance, before we have looked at the unit.
Fitting and calibration of wired sensors is part of temperature sensor installation.
A temperature report for the customer and the auditor
After every run Wialon keeps a record of temperature and humidity tied to time and place. From it you build a report that is easy to put in front of a third party.
What a temperature report usually contains:
- a temperature graph for each sensor over the run;
- a table of readings at a chosen step, for example every 5 or 10 minutes;
- marks for door openings and closings;
- the intervals outside the allowed range, with their duration and peak value;
- the route and the delivery drops.
The report exports to PDF for the customer or to Excel for your own analysis. The template is set up to suit a particular client: some want only the minimums and maximums, others the full table.
For companies rolling out HACCP or working to GDP principles, a report like this covers part of the requirement to record transport conditions. Exactly which records you need in your case is decided by your quality system or your auditor — we set the report up to their format.
The history is useful internally too: compare different vehicles and drivers, find the routes where the temperature consistently climbs, and work out where you need a vehicle with a more powerful unit.
Where to put the sensors: the measuring points
The temperature inside a body is not uniform. It is colder by the evaporator, warmer at the doors and at the floor, and in the middle of a tightly packed load the air barely moves. We agree the layout of the measuring points before fitting and record it in the vehicle's file, so that a year later nobody has to guess what sensor No. 2 is actually measuring.
A small van
One point in the cargo area at mid height, nearer the doors rather than by the evaporator. That is enough for city delivery work if the body is short and loaded evenly.
A semi-trailer
Two points at the very least: at the front wall under the evaporator and at the rear doors. The difference between them shows how the air is moving through the load. If it grows from run to run, it is worth checking the stacking or the unit itself.
A two-compartment body
A sensor in each compartment, and for sensitive loads one more by the bulkhead. In Wialon every sensor is labelled with its compartment and its own range, otherwise the alerts for ice cream will arrive against the vegetable compartment.
What not to do
Do not put a sensor in the cold air stream from the evaporator, on the door, or straight onto the metal of the wall. In those places the graph comes out smooth and pretty, and tells you nothing about the load.
The unit stops en route: a breakdown scenario and checking the sensors
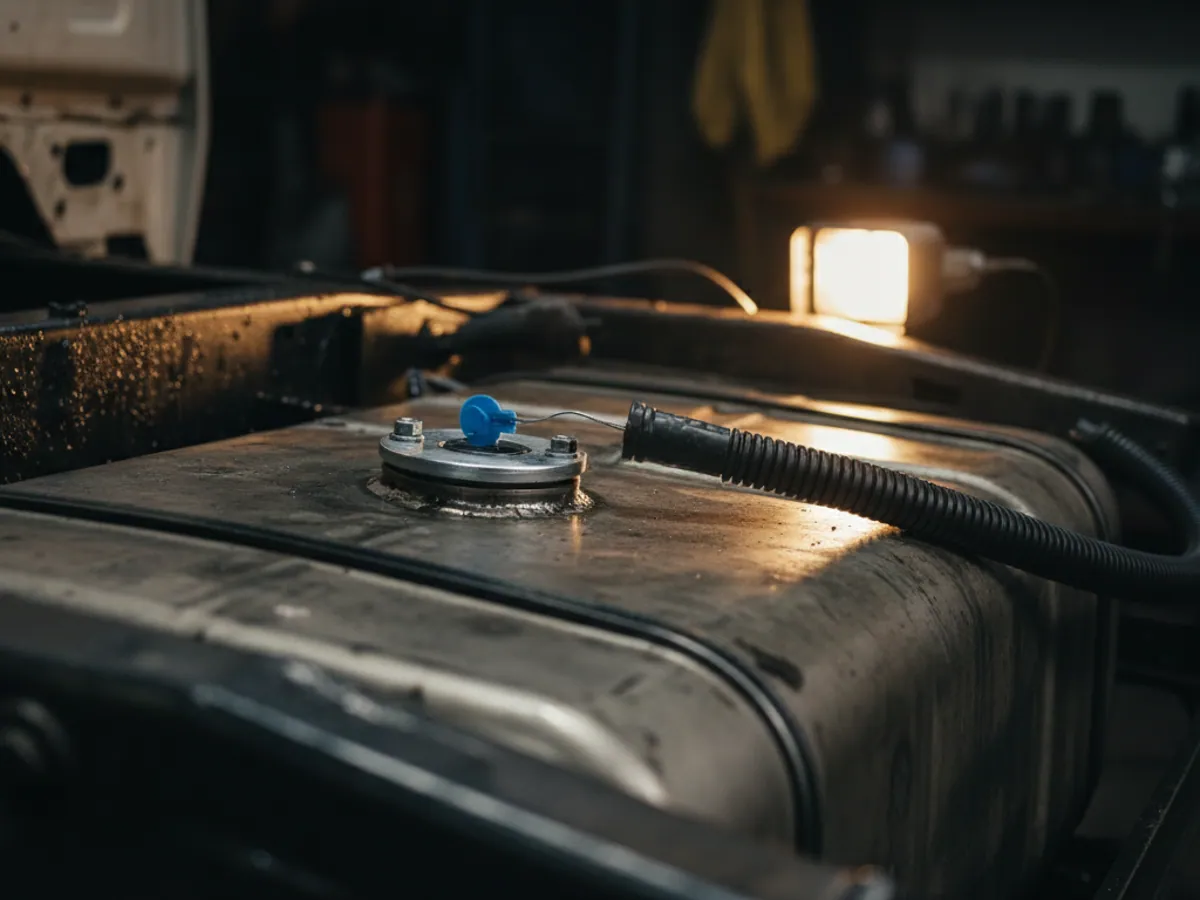
A semi-trailer of chilled meat is running along the M-2 towards Gazakh. In the afternoon it is around +38 °C outside. The refrigeration unit stops: either its own tank has run dry or a protection cut in. Here is what happens next when monitoring is set up:
- The temperature at the doors starts to rise. While it is still inside the range there is no alert, but the climb is visible on the graph.
- Once the reading goes outside the limit and stays there longer than the set delay, the logistician gets a notification with the vehicle, the coordinates and the current temperature.
- The logistician rings the driver. The driver checks the unit, tops up its fuel or restarts it. If the unit will not start, the decision goes up the line: the nearest cold store, transferring the load to another vehicle, or turning back.
- The whole period of the failure, the peak and the duration of the excursion stay in the temperature report. What happens to the consignment is decided by your quality system, not by the driver at the roadside.
It is better to write this order of events down in advance: who the logistician rings, where the nearest cold stores are on the main routes, and who decides on transferring the load.
Trust in the sensor itself is a separate question. Once a season we advise comparing the sensors against a certified reference thermometer: both instruments at the same point in the body, several readings under different settings, the result written down with the date and the serial number of the sensor. If your customer or auditor requires a formal calibration certificate, that is issued by an accredited laboratory, and we discuss it separately for your project.
Common mistakes in cold chain monitoring
These are the mistakes we come across when taking on fleets where sensors were already fitted but nobody trusted the data.
A sensor right by the evaporator
That is the coldest spot of all, and the graph looks perfect even when it is already +10 °C at the doors. The sensor belongs in the cargo area, and in long bodies you want two: at the front wall and at the doors.
Alerts with no delay
Every door opening during unloading gives a brief spike. If an alert arrives for each of those spikes, the logistician gets dozens of messages a shift and starts ignoring all of them, the real ones included. We pick the delay over the first few runs: for chilled delivery work that is usually a few minutes, for pharmaceuticals less. The short deviations do not disappear in the process: they raise no alert, but they are still visible in the temperature report.
One setting for every run
Today the van is carrying ice cream, tomorrow vegetables. If the limits never change, half the runs come with false alerts. The setting is tied to the run or to the loading geofence.
Nobody watches the batteries
A wireless sensor with a flat battery simply stops sending data. We add a notification for data going missing from a sensor and for a low charge, so that replacement can be planned.
What goes on the vehicle
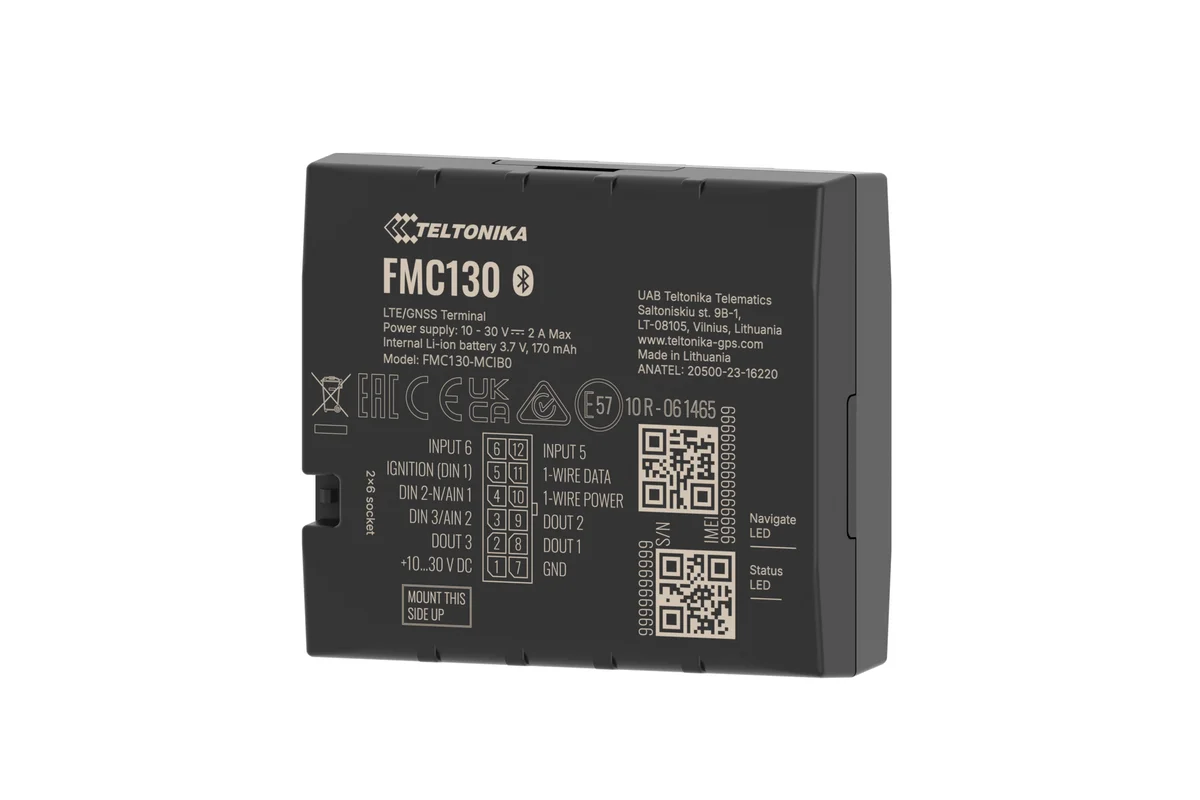
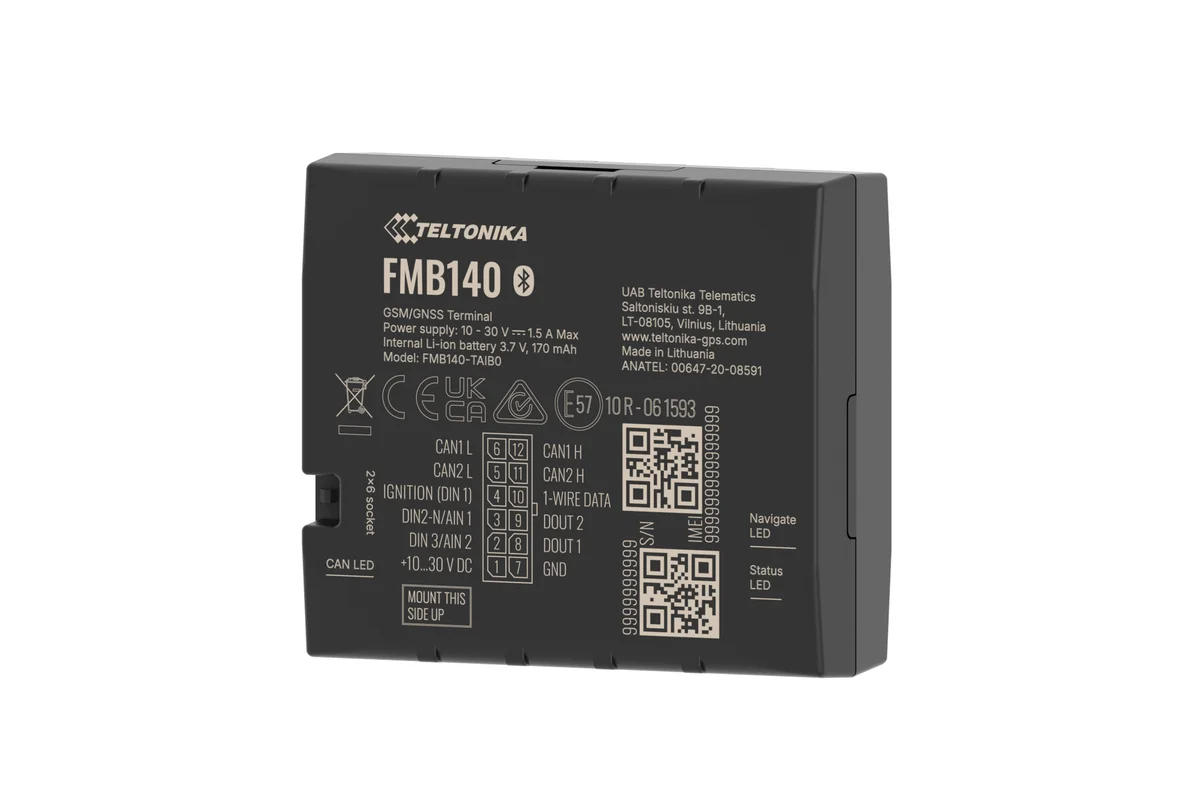
A logger in the body or live monitoring
A logger proves what happened. Live monitoring gives you a chance to step in before the load is ruined.
| USB logger | BLE sensor + tracker | |
|---|---|---|
| Deviation visible en route | No, only after the run | Yes, live |
| Notification to the logistician | No | Yes |
| Tied to the door and the place | No | Yes, on the map |
| Report for the customer | Once the data is downloaded | Yes, at any moment |
| No wiring inside the body | Yes | Yes, BLE |
Fitting and cost
The feature becomes available once you are connected to the GPS.az platform. The cost is made up of the hardware, the fitting and a monthly subscription, which includes the SIM card traffic — the total depends on the type of vehicle and the set of sensors. We prepare an exact quote for your fleet free of charge within one working day.
- 1 Your enquiry and the list of vehicles
- 2 The quote and an agreed fitting schedule
- 3 Fitting the hardware at your own site
- 4 Setting up reports and alerts in Wialon, and training the dispatcher
Questions about “Temperature and cold chain monitoring”
Request a call
A specialist will call back and match a solution to your fleet and your task.