
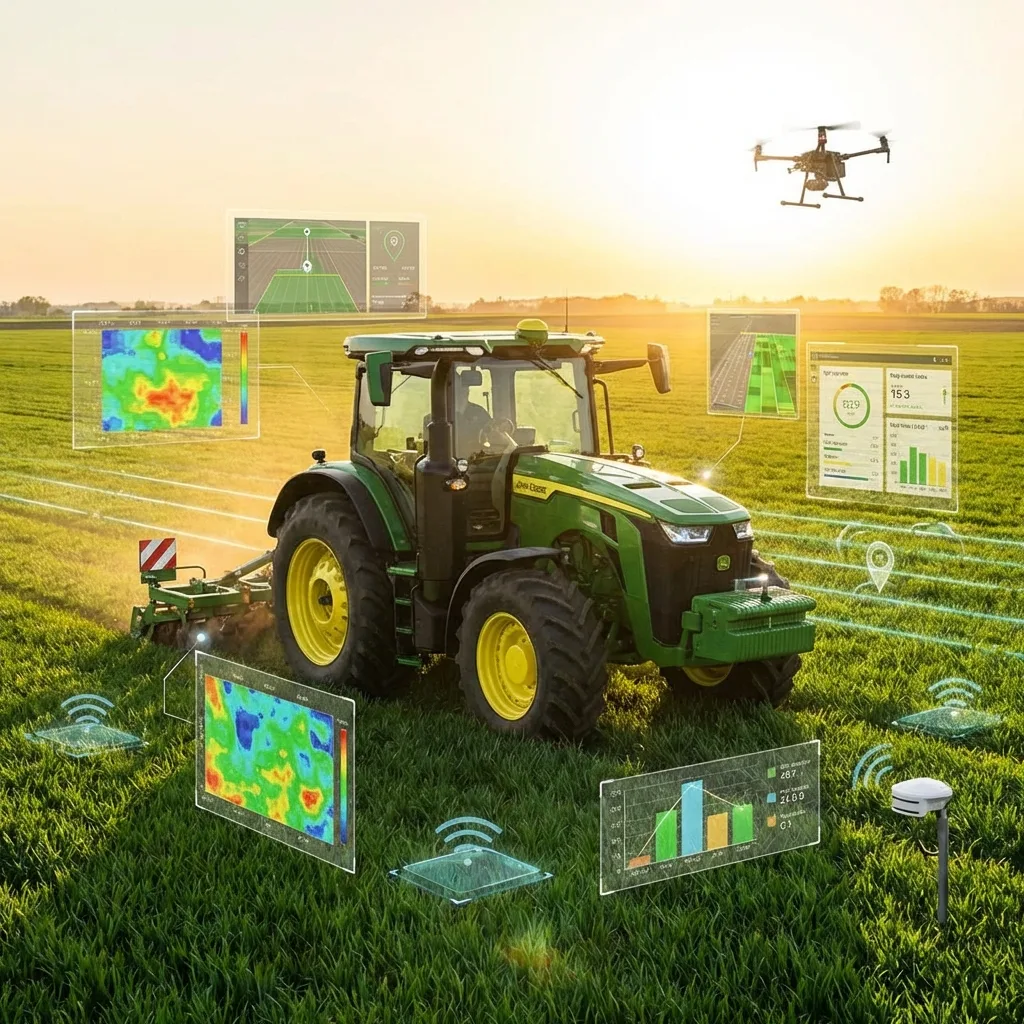
GPS monitoring for agriculture and agribusiness
Wheat in the Kura-Aras lowland, cotton in Sabirabad and Beylagan, hazelnuts in Sheki and Zagatala, vineyards in Shamkir. In season dozens of machines are out in the fields, and every day of downtime or spare litre of diesel shows up in the cost of the crop.
GPS.az fits trackers and fuel level sensors to tractors, combines, sprayers and grain lorries, and helps you see how many hectares have actually been worked.
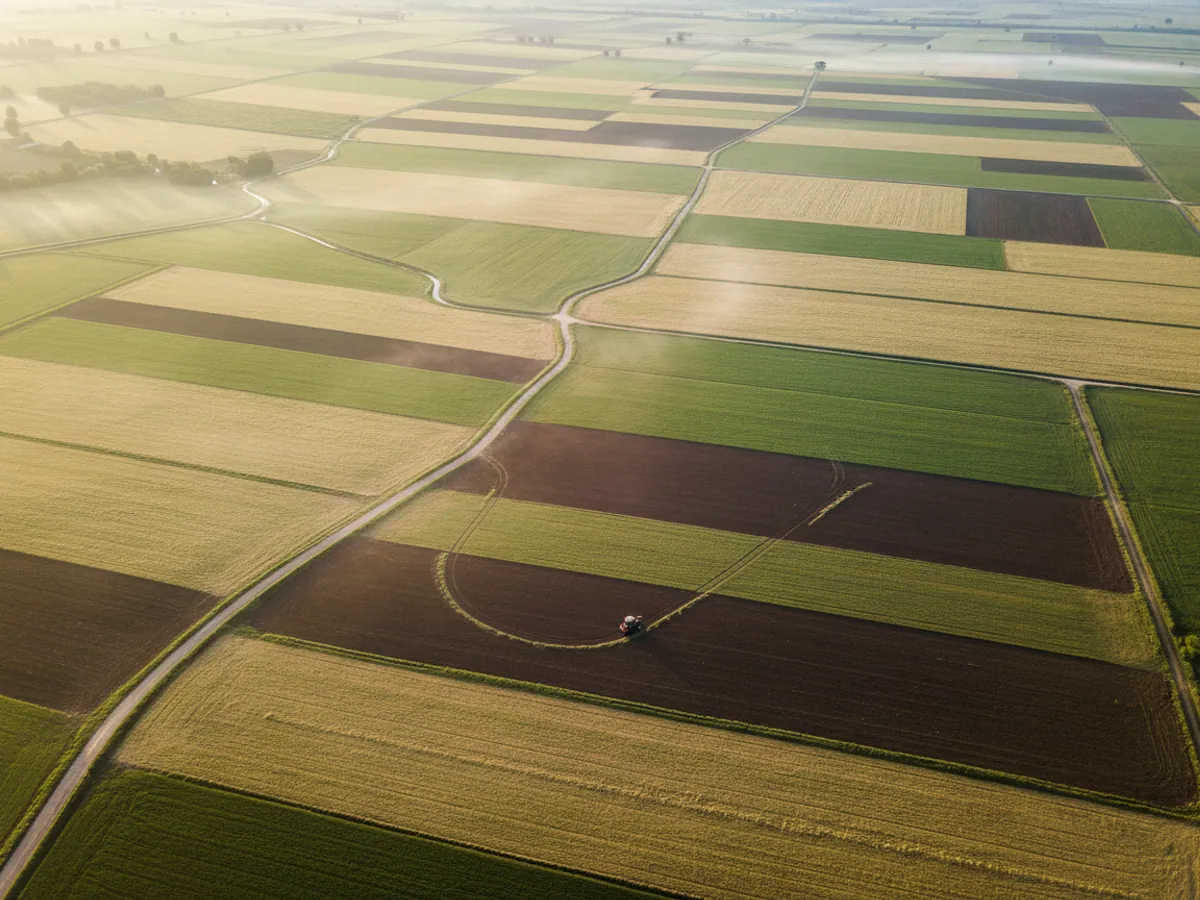
You cannot see the field from the office
An agronomist can drive round several plots in a day. A farm of 2,000-3,000 hectares he will never cover. Hence the perennial questions: how much has really been ploughed, why is one driver's consumption per hectare half again as high as his neighbour's, where did the grain lorry go between the field and the elevator.
GPS monitoring in agriculture answers those questions with figures. A tracker on a tractor knows the working width of the implement and calculates the area worked from the track. A sensor in the tank shows refuelling and drains. Field geofences tie all of it to a particular plot and crop.
The distinctive thing about the industry is its seasonality. Machinery can stand under a canopy for a month and then work round the clock for three weeks. The system needs to be started early, so that by sowing or harvest it is already configured and tested.
Solutions by sector: agriculture & agribusiness
Where agribusiness loses money
Diesel in season
During harvest machines are fuelled in the field from barrels and bowsers, and the record is kept on paper. This is where the discrepancies are largest. The losses we see before fuel level sensors are fitted are usually 10-20% of the season's fuel.
Hectares counted twice
The operator writes down the whole plot, while the track shows 80% worked. Or the field was gone over twice, because nobody could see where the previous implement had finished.
Harvest lost on the way to the store
A grain lorry is loaded at the combine, and reaches the elevator weighbridge three hours later instead of forty minutes, and lighter than it should be. Without a track and body monitoring nothing can be proved.
Machinery working someone else's land
The tractor works for the farm by day and ploughs the neighbour's plot in the evening. The engine hours and the fuel are yours, the money is the operator's.
Breakdowns at the height of harvest
A combine stops in mid-June and the spare part takes two days to come from Baku. Planned servicing by engine hours reduces the chance of that breakdown, but only if someone is counting the hours.
No figures to decide on
Which field is the most expensive to work, which tractor is better written off, what a hectare of wheat actually costs. Without data these are decided on instinct.
The seasonal calendar and monitoring
Every crop in Azerbaijan puts its peak load on machinery at a different time. We plan the roll-out around it.
- Autumn - sowing winter crops. Wheat and barley are sown mainly in October and November. This is the time to check the trackers, recalibrate tanks after summer repairs and update the field geofences.
- Spring - spring crops, cotton, vegetables. The busiest period for tractors and seed drills. Reports on area worked and consumption per hectare matter most here.
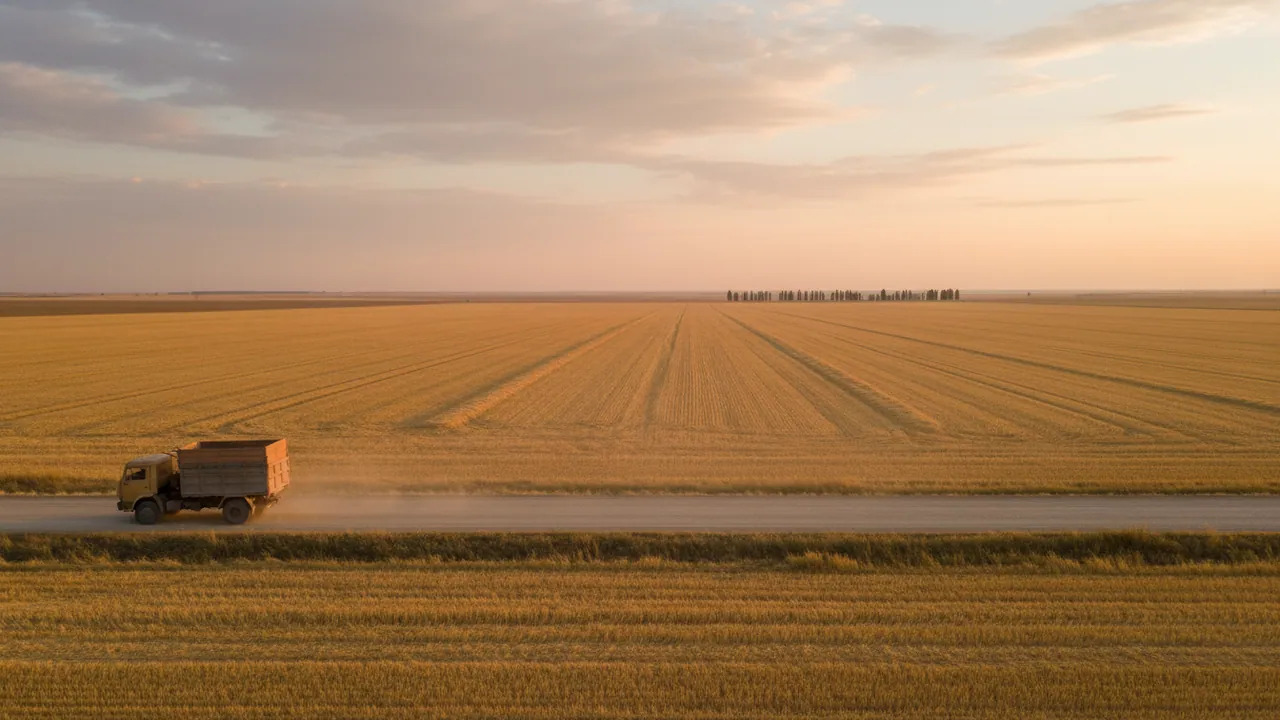
- June and July - grain harvest. Combines and grain lorries work almost round the clock. What matters is the chain of combine to grain lorry to threshing floor or elevator, and fuel control in the field.
- August and September - hazelnuts. In the Sheki-Zagatala zone the load falls mainly on haulage and drying, less on field machinery.
- September to November - cotton. Cotton pickers and haulage of raw cotton to the mills of the Central Aran region.
The best time to start is a month to six weeks before your main season. Fitting during harvest is possible, but the operators have no time to spare, and the first data goes on getting used to the system.
From field to processing: five directions
Farms differ enormously, so the solutions are split by type of business.
If you have fields and machinery, start with the crop farming section. It covers accounting for hectares, implements and work on plots.
Livestock farms, poultry houses and pastures live by other rules: what counts there is feed, the indoor climate and moving stock to summer pastures in the mountains. That is covered in the section on livestock and poultry.
Large companies with several farms in different districts need an overall picture and a way to compare their units. We handle that on the page for agricultural holdings.
The harvest still has to be carried: grain lorries, articulated lorries taking fruit for export to Russia, haulage of raw cotton. See agri-logistics.
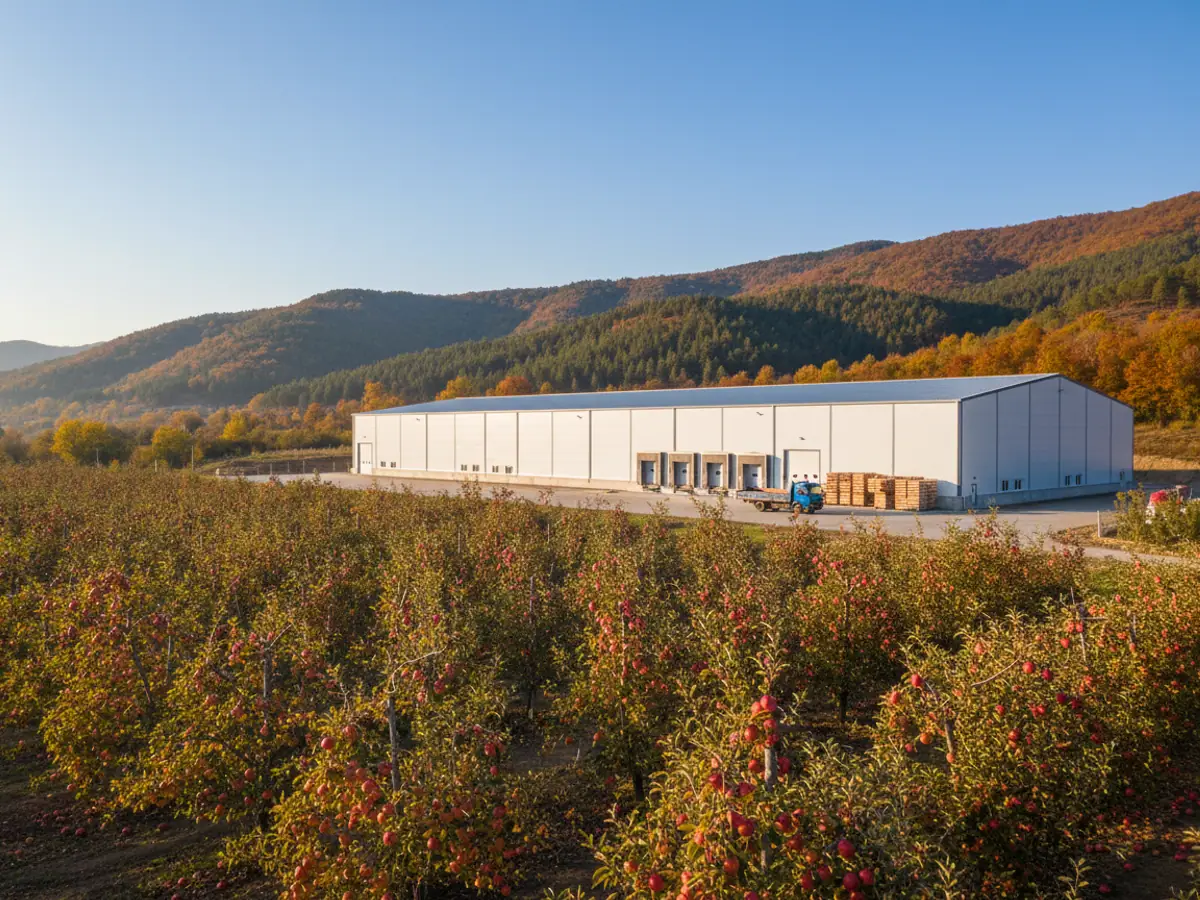
And the last link is elevators, fruit cold stores and processing plants. Those are covered in processing and storage.
What works on farm machinery
Tracker and field geofences
Every field is entered into the system as an outline. The report shows which machines worked on each plot and for how long. The outlines can be drawn on the map or uploaded from a file.
Accounting for area worked
The implement width plus the track, and the system calculates hectares, overlaps and skipped strips. This uses the Wialon Hecterra module, built specifically for agriculture.
Fuel level sensor
On tractors it is often awkward to run a cable to the tank. A wireless fuel level sensor helps here, sending its data to the tracker over Bluetooth: we select the model to suit the tank and the tracker during fuel level sensor fitting.
Identifying the mounted implement
A tag on the plough, seed drill or sprayer tells the tracker what exactly is hitched on. Without it the system does not know the working width and confuses one type of work with another.
Identifying the operator
A driver card or fob. When one tractor passes through two or three operators in a day, piece-rate pay cannot be worked out fairly without identification.
Sensors in stores and cold rooms
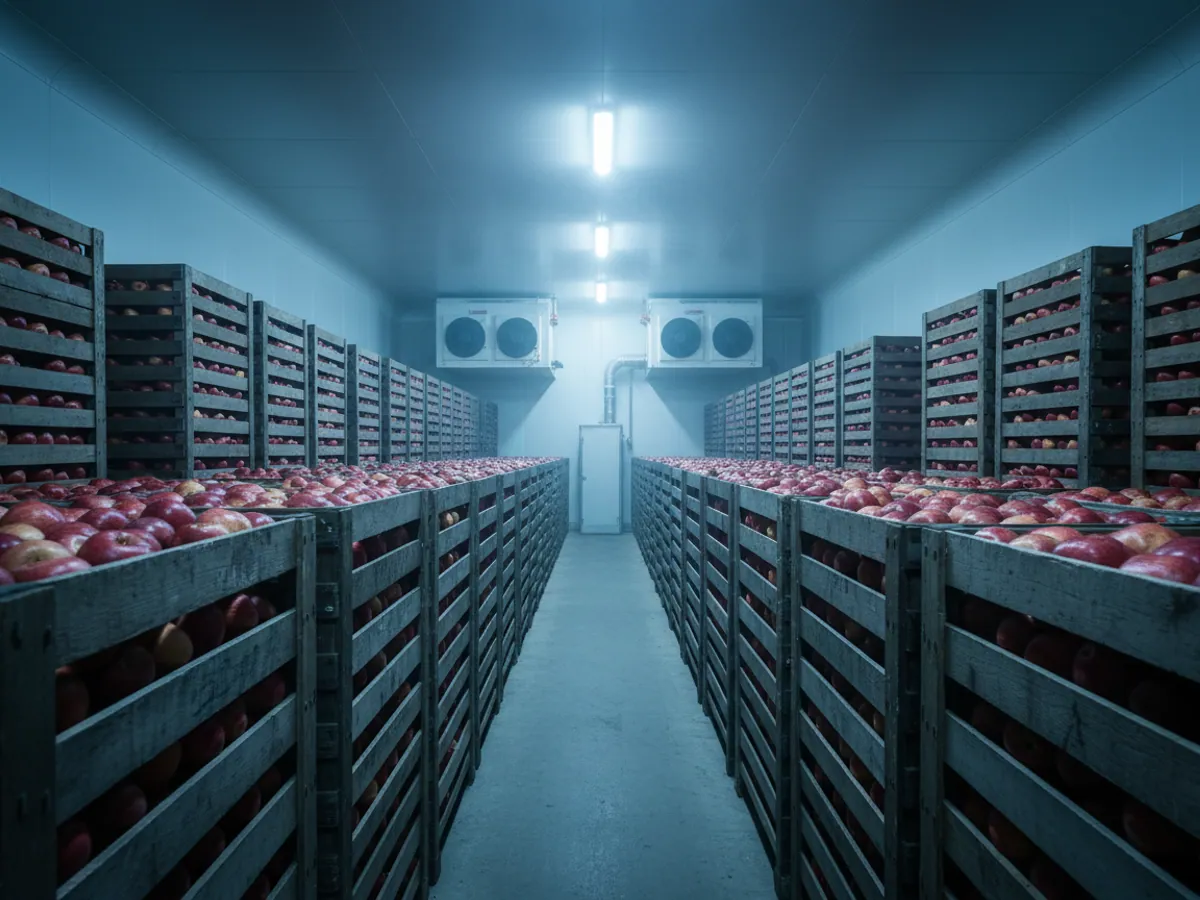
Temperature and humidity in fruit cold stores and grain stores. If the temperature rises in an apple store near Guba, the notification arrives during the night rather than in the morning.
What a harvest day looks like in the reports
Picture a farm near Beylagan: four combines, six grain lorries, a fuel bowser. June, heat approaching forty degrees, work from first light until dark.
In the morning the agronomist opens his phone and sees which fields were harvested yesterday and how many hectares are left. One of the combines stood idle for three hours in the middle of the day. The history shows the engine was running while the combine was not moving: that is what a breakdown or a wait for a grain lorry looks like. A call to the mechanic, and it turns out they were waiting for a lorry that had gone to the threshing floor by a different route.
The bowser issued 900 litres during the day. The refuelling recorded by the sensors in the tanks of the combines and lorries adds up to 840. The 60-litre difference is not necessarily theft: machines without a fuel level sensor may have been filled. But now the question can be put to a particular person about a particular refuelling.
In the evening a summary arrives: area harvested, fuel used, how many runs each grain lorry made. Previously this was gathered from bits of paper by the end of the week. There is more on how agricultural monitoring works in the system on the page about monitoring field operations.
Field, road, store: three processes with different reports
On a farm, monitoring almost always touches three different processes. It helps to separate them from the start: each has its own data, its own owner and its own question.
- Field operations. Tractors, seed drills, sprayers, combines. The question: how many hectares, under which operation and at what consumption per hectare. The owner is the agronomist and the chief engineer. The data: track, implement width, working position sensor, fuel level sensor.
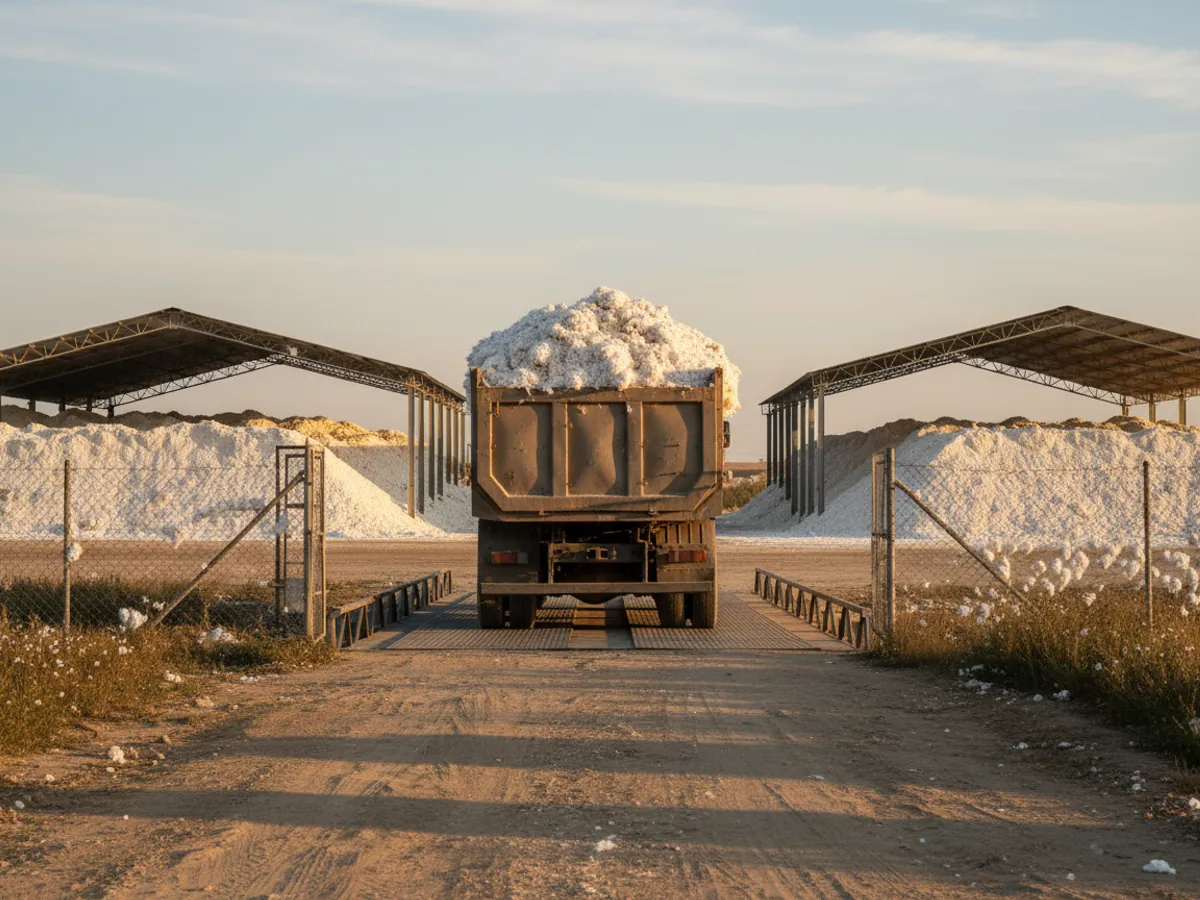
- Harvest haulage. Grain lorries, tippers carrying cotton, hired vehicles. The question: did everything loaded in the field reach the weighbridge, and where did the vehicles stop. The owner is the logistician or the manager of the threshing floor. The data: track, body lift, weighing log.
- Storage. Stores, cold rooms, dryers. The question: are the storage conditions holding and how much fuel went on drying. The owner is the store manager. The data: temperature and humidity sensors, fuel level sensors on static tanks.
There is no need to start with all three at once. Usually a farm takes the process that raises the most questions right now and adds the others by the next season.
Criteria for a seasonal pilot
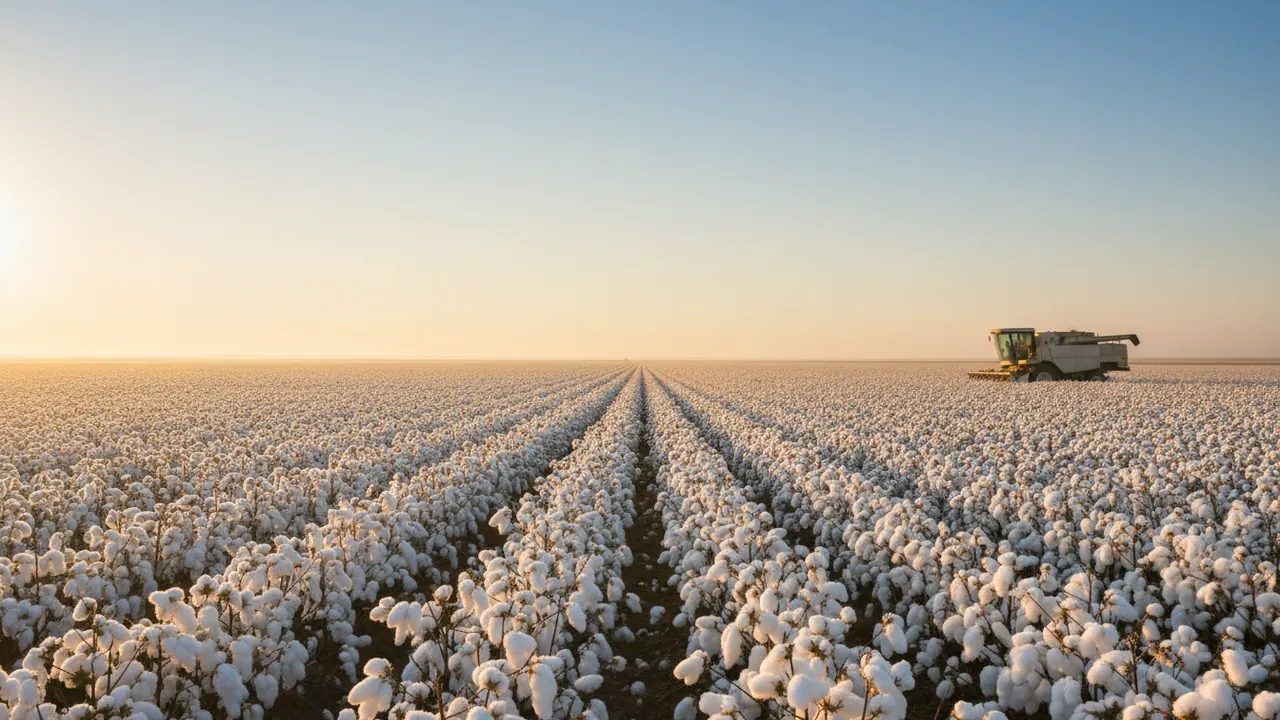
A seasonal pilot tests the system on one process and part of the fleet in real work, during sowing or harvest. So that the results make it clear whether to extend the system or not, we agree the criteria before fitting:
- the area of the control field according to the system is reconciled with the paperwork, and any discrepancy is explained;
- fuel issued from the bowser is visible in the tanks of the machines, and the difference is accounted for;
- the number of grain lorry runs on the track matches the weighbridge log;
- notifications about drains and work outside the fields reach a named person, and each one is looked into.
From the farm we need the field outlines, a list of machines and implements, the fuel issue record and the weighbridge log for the pilot period. Without them there is nothing to reconcile the system against.
Roll-out a month before the season
Below is how it looks on a mid-sized farm: 20-40 machines, several plots in one district.
Four steps
Week 1. Inventory of machines and fields
We draw up a list of machines and mounted implements and collect the field outlines. If there are no outlines, we help draw them. The terms of the service are on the page GPS monitoring of farm machinery.
Week 2. Fitting at the depot
A crew comes out to the farm and installs the equipment right there in the machinery yard. In a day we usually connect 4-6 tractors with fuel level sensors.
Week 3. Calibration and checks
We calibrate the tanks, check the implement tags and make a trial run. Consumption norms per hectare are set by type of work.
Week 4. Training the agronomist
We walk through the reports on fields, fuel and operators using your own machines. The agronomist usually finds it easiest to look at the data on a phone, out in the field.
Questions from farmers and agronomists
How it is used in this industry
Case studies from “Agriculture & Agribusiness”
The GH5200 personal tracker for workers
Agriculture, construction and mining
Service schedules for farm machinery from CAN data
Agriculture, construction and mining
Field worker records with the ATC700
Assets and workforce
GPS monitoring for “Agriculture & Agribusiness”
Send us an enquiry and we will prepare a quote for your fleet and pick the hardware that suits this industry.
- 1 We pin down the task
A specialist calls back and asks about the vehicles, how many there are and what you need to keep an eye on.
- 2 We put a solution together
We propose the hardware and the features, and set out the one-off and the monthly cost separately.
- 3 We agree the fitting
At your yard or at ours, on a schedule that keeps the vehicles working.
Request a call
A specialist will call back and match a solution to your fleet and your task.