
GPS monitoring of farm machinery and field operations
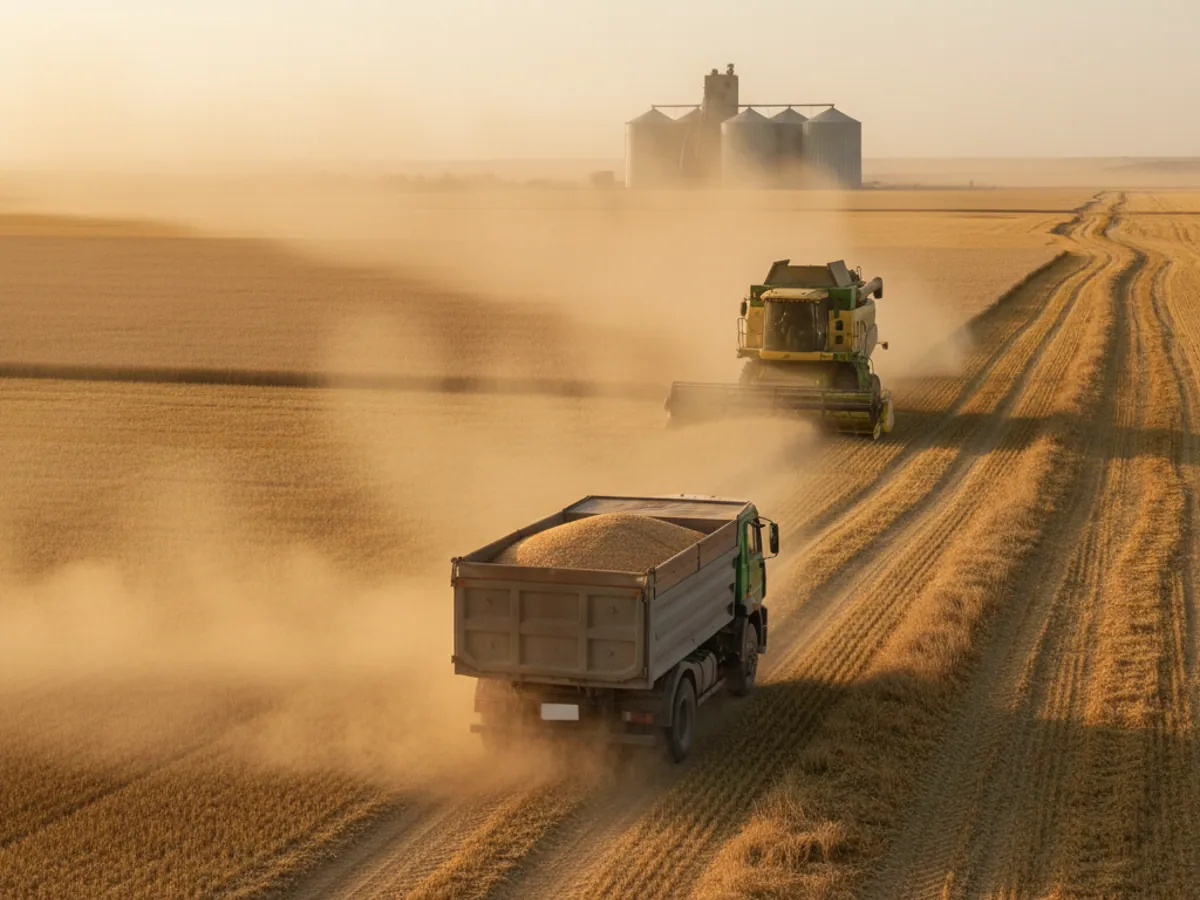
GPS monitoring of farm machinery from GPS.az shows where every tractor and combine harvester is working, how many hectares have actually been covered and how much fuel went into each hectare. The farm manager and the agronomist can follow field operations without driving out to the fields, and missed strips, overlaps and unauthorised trips end up in a report instead of getting lost in verbal updates.
From the data on board to the dispatcher's decision
Tracker and fuel sensor
The tracker logs the track, ignition and fuel; the reader identifies the operator and the mounted implement.
Field boundaries
Fields are set up as geofences, so the system knows where work is going on and where it is only transit or a stop.
Wialon Hecterra
From the track and the implement width it builds the worked strip and counts hectares, missed patches and overlaps.
Report for the agronomist
Hectares, litres per hectare and idle time for every machine and operator, per shift or per season.
Features and tools
Field
- Worked area calculated from the track and the width of the implement.
- Detection of missed strips and overlaps during soil cultivation.
- Route planning and verification of completed assignments.
- Analysis of satellite imagery and vegetation maps of the fields.
Machinery
A day of sowing as the agronomist sees it
A hypothetical example: a farm near Beylagan with three tractors sowing cotton. This is how the day looks in the reports.
- Tractor No. 3 left the depot for field No. 7 on time
The operator tapped his card and the system logged the implement: an eight-row seed drill.
- A 50-minute stop by the shelter belt idle
The engine was running while the machine stood still. The agronomist rings up and finds out they were waiting for seed from the yard.
- A worked strip with a gap in it 0.8 ha missed
The map shows an unsown strip along the canal. It gets sown before the end of the day, rather than being discovered when the crop comes up.
- Consumption on tractor No. 5 above the norm +2.5 l/ha
Comparing it with the other machines on the same job shows where to check the settings or the hitch.
- The tractor moved after the shift ended off schedule
Ignition outside working hours and a departure from the depot geofence, so the manager gets a notification.
Where the extra hectares in the tally sheet come from
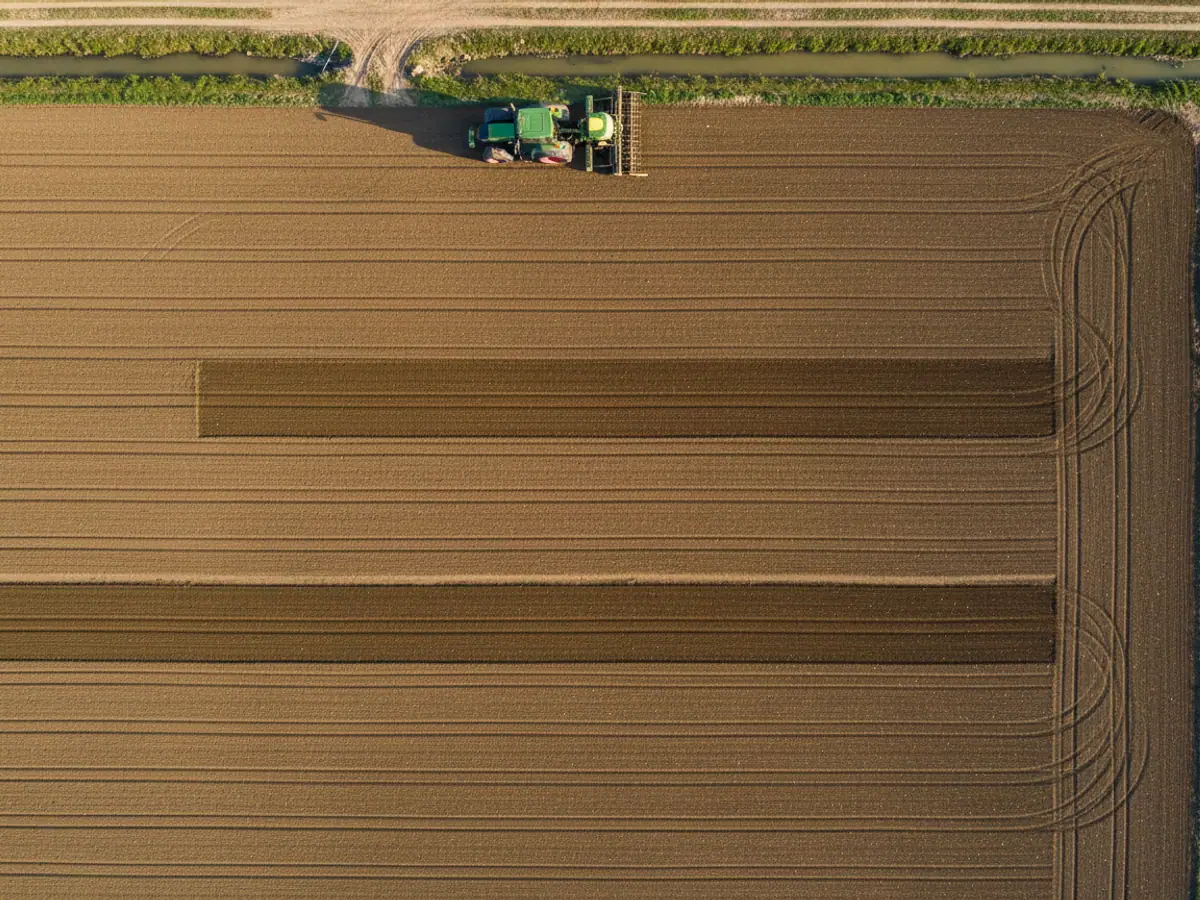
The operator reports 120 hectares sown. The track of the tractor, with a seed drill six metres wide, works out at 104 hectares, and on two of the fields there are visible strips the implement went over twice. That 16-hectare difference is seed, fertiliser and diesel written off but never put into the ground. We see discrepancies like this on almost every farm in the first season after the trackers go in.
The system calculates the area from the actual track and the working width of the mounted implement, not from what the foreman says. The tracker logs a point every few seconds, the Wialon platform builds a worked strip out of those points and lays it over the field boundary. Anything that falls inside the boundary once counts towards the worked area. Repeat passes are highlighted as overlap, and anything left uncovered as a missed patch.
Field boundaries are loaded once: from a shape file, from KML, or drawn by hand over satellite imagery. For farms in the Kura-Araz Lowland, where cotton and grain fields are often laid out as rectangles of 20 to 50 hectares, that takes our engineer a day or two. From then on the records are kept by the Wialon Hecterra module: fields, crops, types of work, assignments and reports for every implement. How the field records tie in with hauling the crop and the store is set out on the page of solutions for agribusiness.
How the area is worked out: an example with working width and overlap
A hypothetical example, so the arithmetic is visible. The field is a rectangle of 1,000 by 120 metres, which is 12 hectares. A seed drill six metres wide should cover it in 20 runs. If the operator keeps the implement perfectly edge to edge, the track gives 20 strips of 6,000 m² each and exactly 12 hectares.
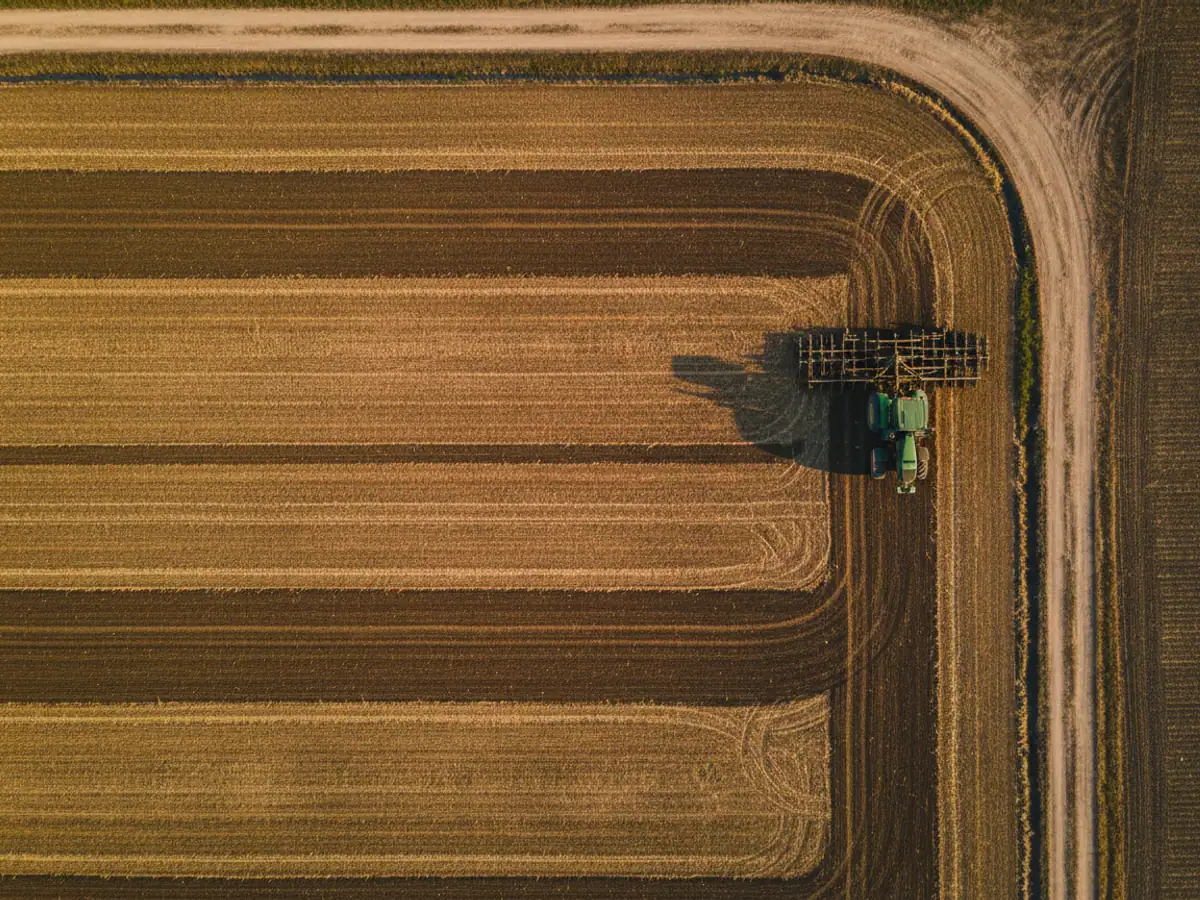
In practice, neighbouring passes overlap one another. Say the average overlap at each of the 19 joins is 0.5 metres. That is 19 × 0.5 × 1,000 = 9,500 m², almost a hectare that the seed drill went over twice. The platform will show 12 hectares of strip covered along the track, but the unique worked area will be around 11 hectares, and closing the field will take another run or two. The seed and fuel spent on the overlap are gone, and the area has not grown because of them.
The second mistake is the wrong width in the settings. If the implement record says six metres while the real working width is 5.4 metres, the system will overstate the area by 10% on every pass. That is why we measure the width with a tape on the implement itself rather than taking it from the data sheet.
- Turns on the headland do not count towards the area if the report has a speed threshold set or the implement has a working sensor.
- On irregularly shaped plots and in orchards the margin of error is greater: there it matters more that the pass happened at all than that the hectares are exact to two decimal places.
- Track accuracy depends on the receiver: an ordinary GNSS tracker is no substitute for RTK guidance for driving along a line, it is there for record keeping, not for steering.
A check on a single field before connecting the whole fleet
Before fitting trackers to every tractor, we suggest testing the area calculation on one field whose dimensions are known. That way the agronomist sees for himself where the figures in the report come from, and everyone agrees in advance what discrepancy counts as normal.
1. Pick a control field
A field whose area is known from the paperwork or from a survey, preferably a regular shape. We load the boundary into Wialon from KML or draw it over the imagery together with the agronomist.
2. Measure the implement and set it up
We measure the working width on the spot and record it in the implement's record, along with the way work is detected: a sensor on the mounted equipment, on the boom, or a speed threshold.
3. Run an ordinary shift
The operator works as he always does, with no prompting. The foreman keeps his own tally sheet in parallel, so there is something to compare against.
4. Compare three figures
The area of the boundary, the area in the Hecterra report and the area on the tally sheet. On the map we look at the joins between passes, the missed patches and the turns. Every discrepancy should be explained by something visible on the track.
5. Agree the outcome
If the report matches the boundary within the tolerance agreed beforehand, we carry the settings over to the remaining implements. If it does not, we look for the cause: the width, the point interval, the work sensor, the field boundary. Only then do we extend the rollout.
What we monitor on different field operations
Soil cultivation and the sowing season
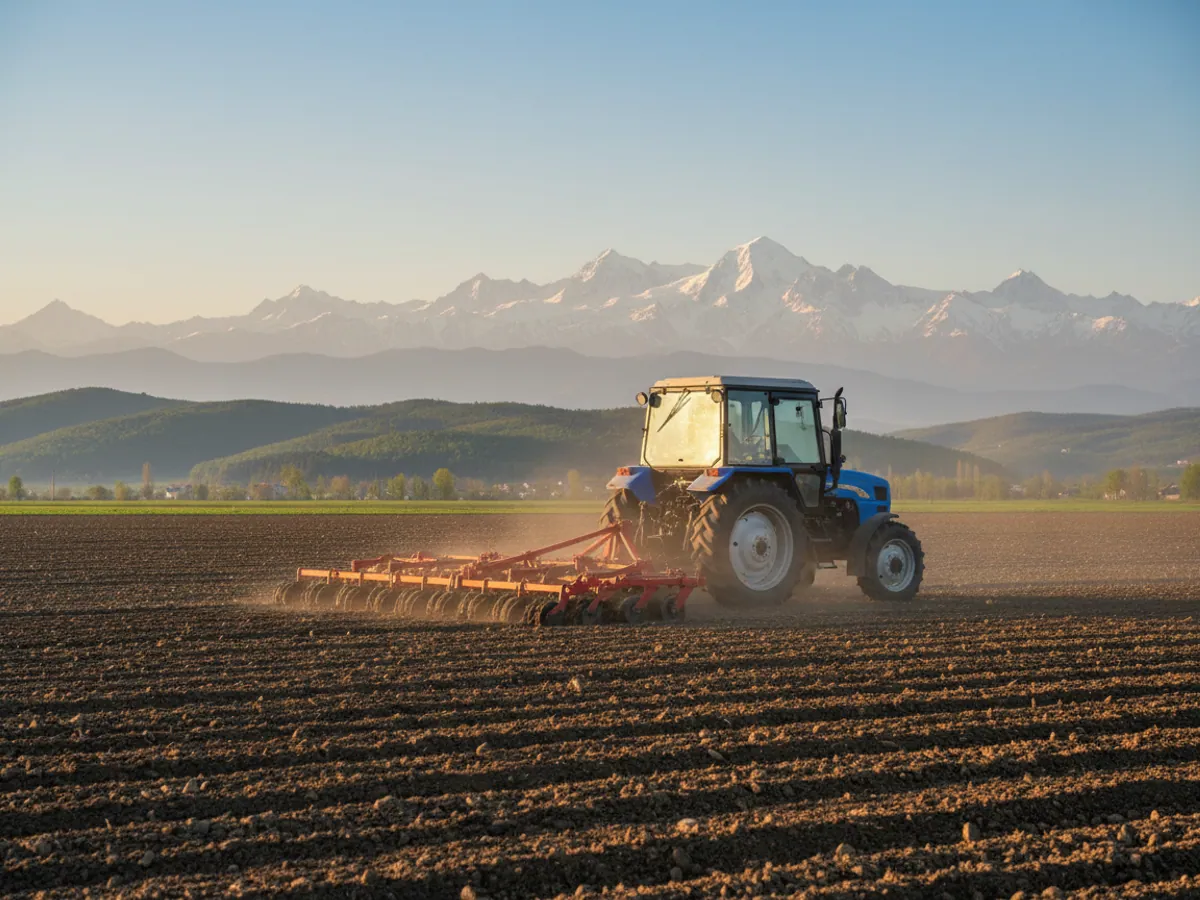
On ploughing and cultivation the main question is the real area and the working depth across the whole field, not just along its edge. The area comes from the track, and the fact that the implement was working comes from a sensor on the mounted equipment or a plough position sensor. If the tractor drove across the field with the plough raised, that shows up in the report as an unproductive pass.
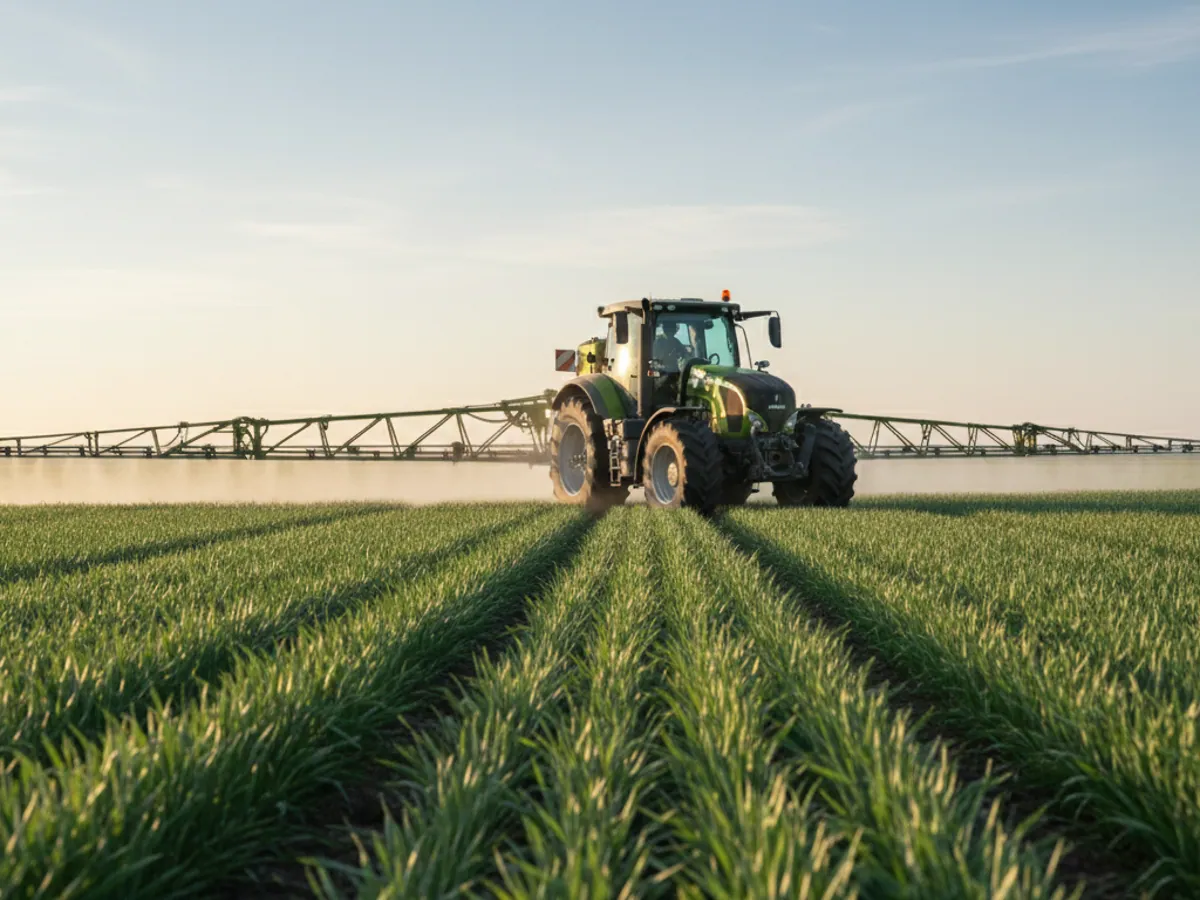
For sowing we add speed monitoring: a seed drill running at 14 km/h instead of the recommended 8 to 10 gives uneven seed placement. The system marks the stretches where the limit was exceeded on the field map, and the agronomist sees them before the shortfall shows in the emerging crop.
What equipment goes on a tractor and a combine harvester
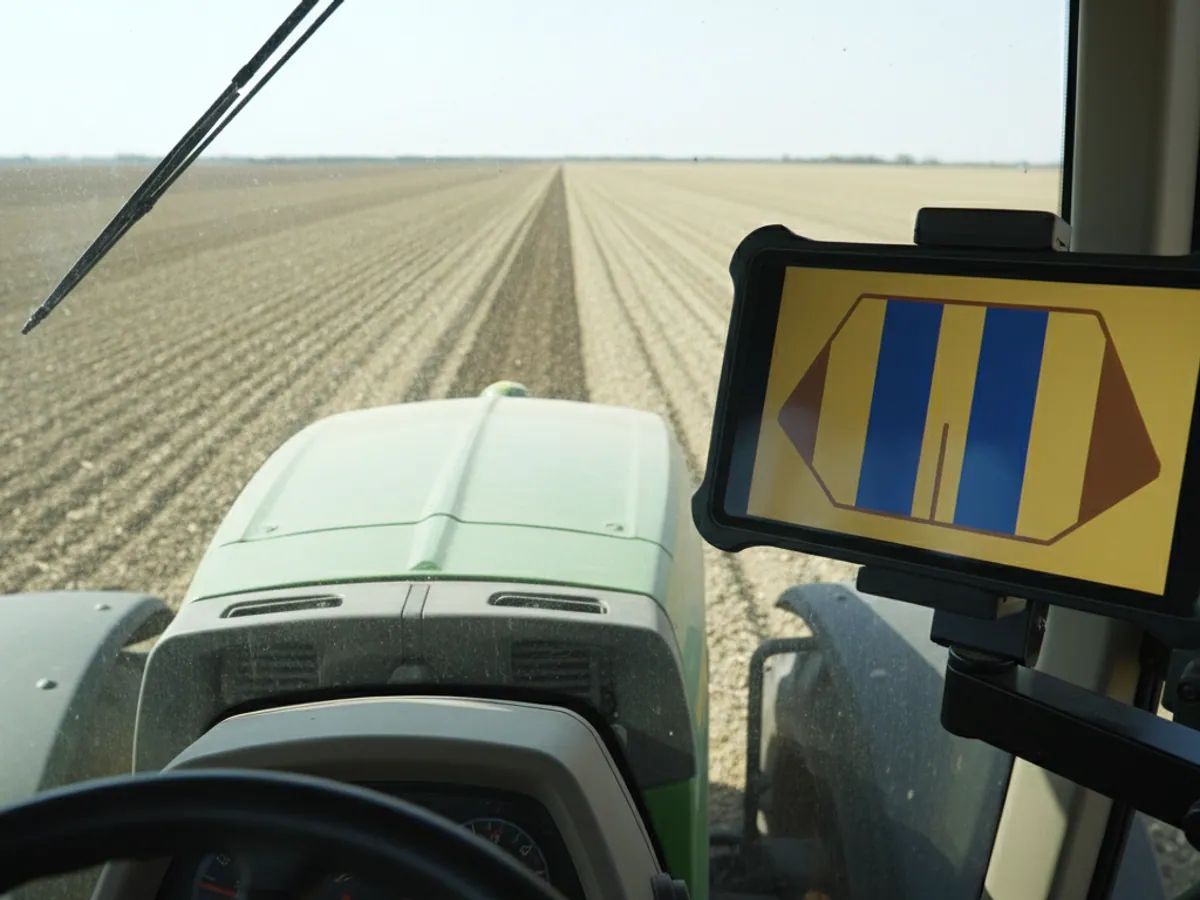
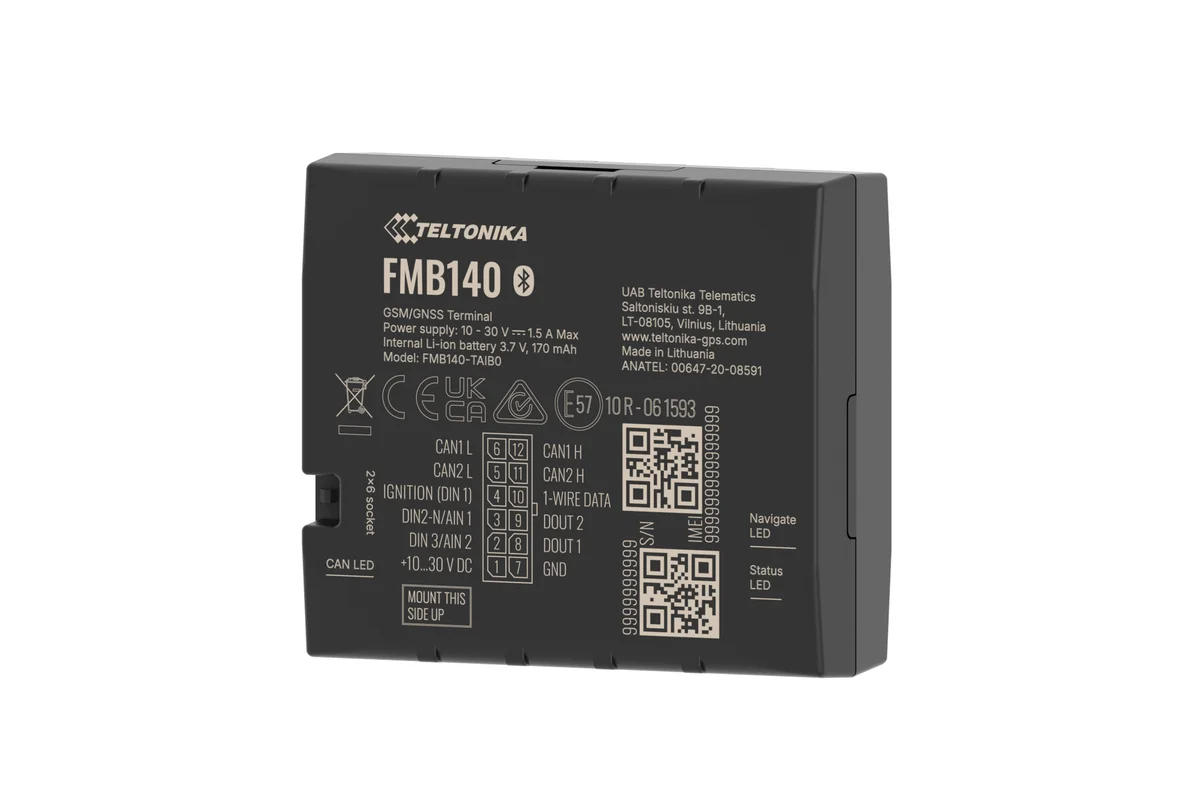
The basic kit is a Teltonika FMB140 or FMC130 GPS tracker powered from the on-board electrics. The tracker sits in a dust- and moisture-protected compartment in the cab, with the aerials routed so that they do not obstruct the view. On older MTZ and YuMZ machines with no electronics this is enough to record area and working time.
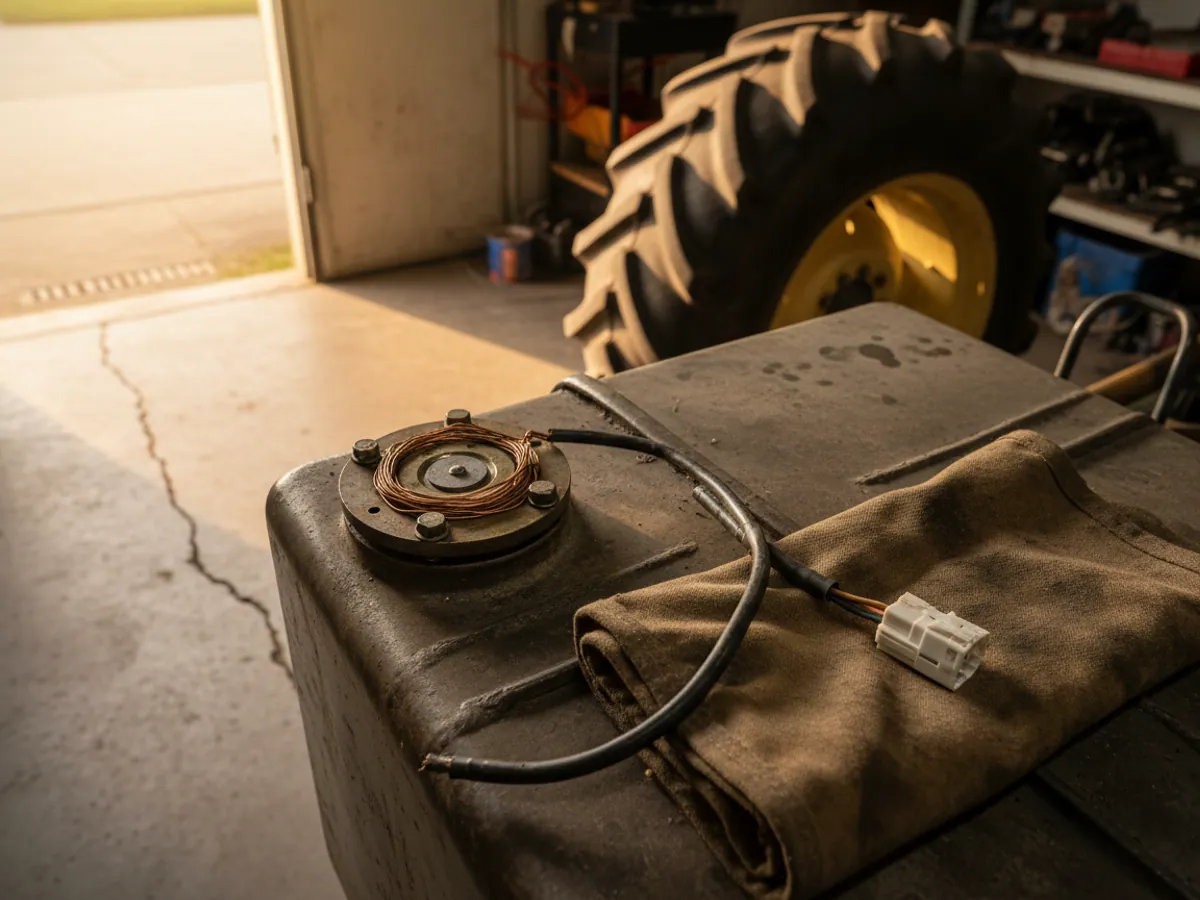
- A fuel level sensor in the tank, to work out consumption per hectare and catch fuel drains. On tractors with an irregularly shaped tank we calibrate by measured filling.
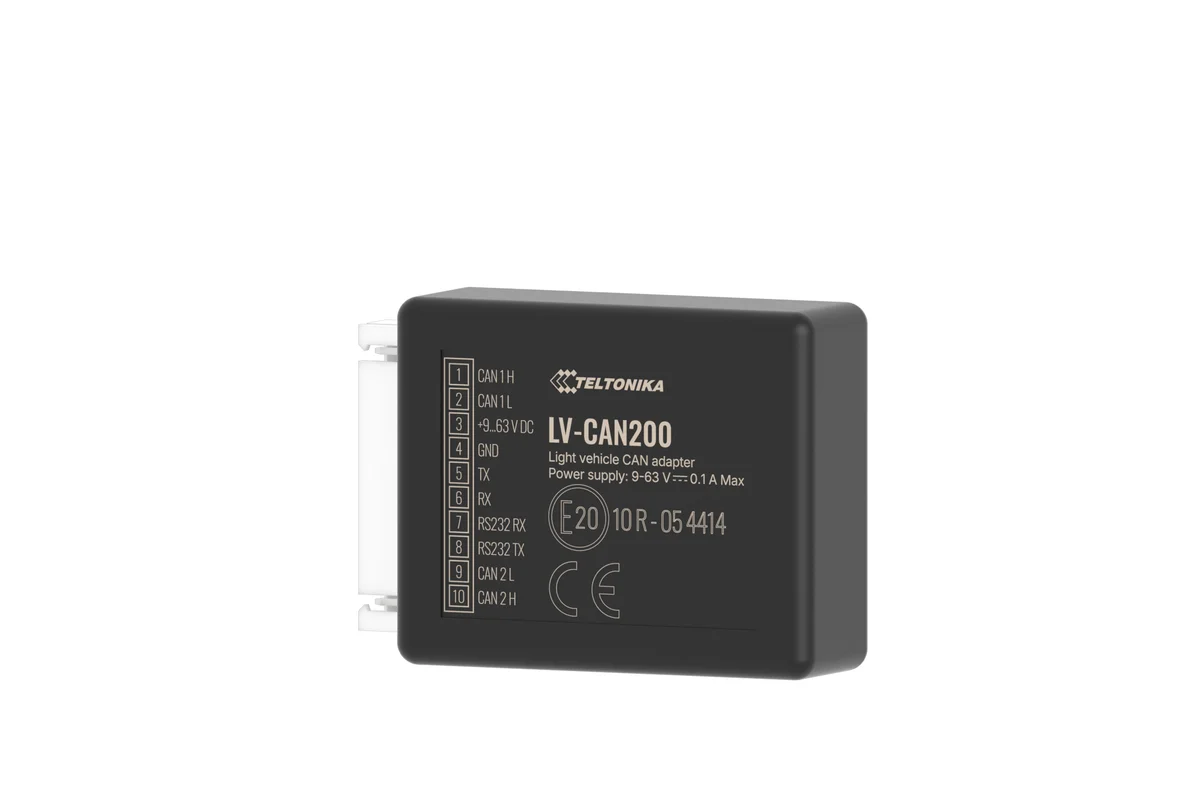
- A CAN adapter on modern John Deere, Claas and New Holland machines: we take engine speed, engine hours and consumption straight off the engine bus.
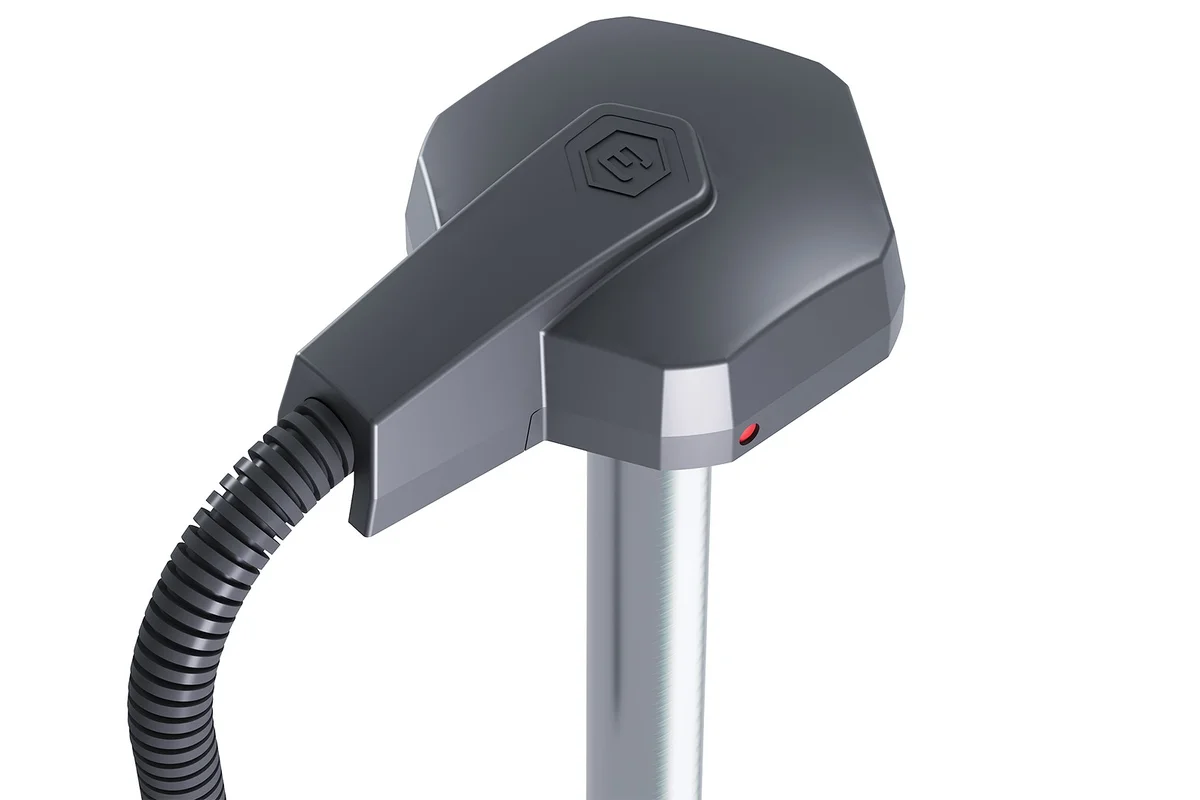
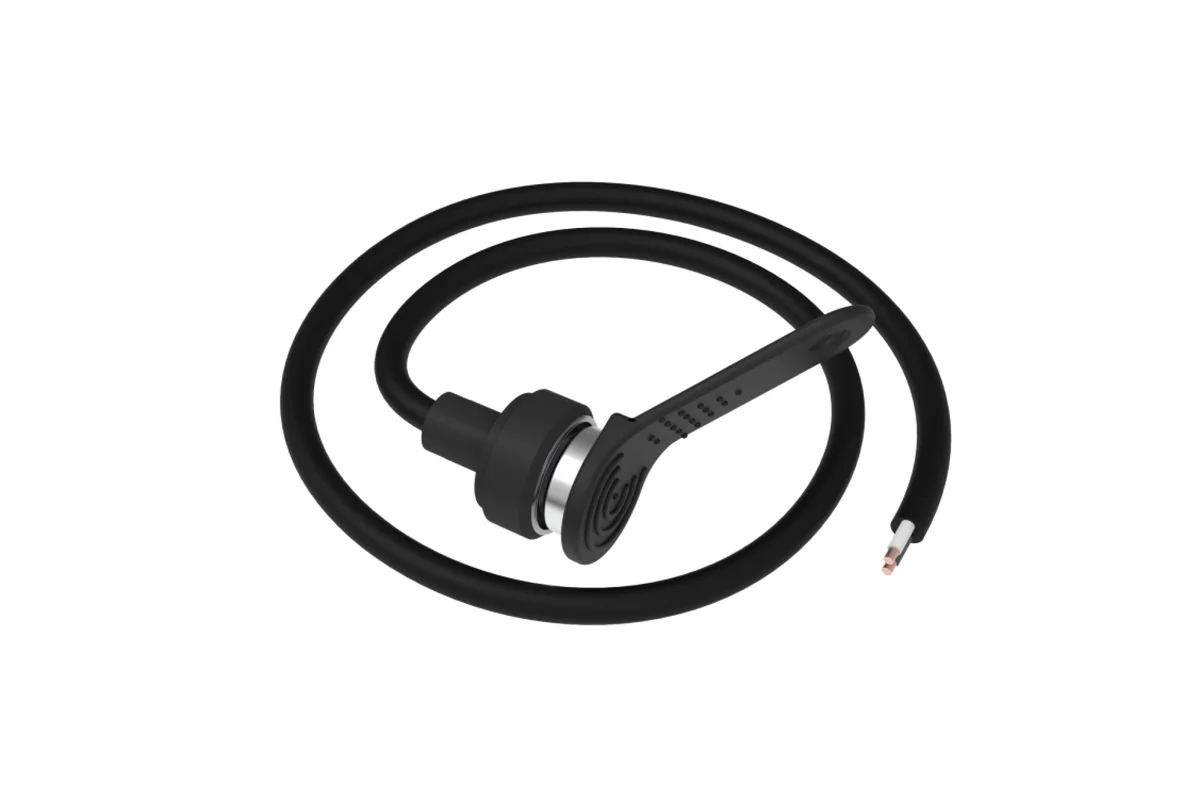
- An iButton or RFID card reader: the operator presents his key at the start of the shift, and every hectare goes against his name.
- BLE tags on the mounted equipment, so the system knows for itself that the tractor is currently carrying a seed drill rather than a cultivator, and applies the right working width.
An honest limitation: GPS cannot see ploughing depth or seed rate. That needs sensors on the implement itself or the manufacturer's own on-board terminal. We can pull their data into Wialon if the protocol is open, but that is decided for the specific machine.
Mistakes that stop agricultural monitoring from paying off
The trackers are fitted, the reports arrive, and yet nothing is saved. Most often the reason lies in the settings and in who looks at the data and how. Here is what we come across in practice.
The wrong working width
The same tractor pulls a four-metre harrow in the morning and a nine-metre cultivator after lunch. If a single width is entered against the tractor, the area is out by half again or double. The answer is BLE tags on the implements, or having the operator select the implement when he starts work.
No field boundaries
Without boundaries the system counts everything indiscriminately: a turn on the road, a drive across a neighbouring plot, a trip out onto the main road. In the first weeks of the rollout we draw the fields together with the agronomist, otherwise there is no point opening the hectare reports at all.
Fuel accounted for by receipts alone
A tracker without a fuel level sensor will show how long the tractor worked, but not how much it burned. Consumption per hectare without a fuel level sensor or CAN is an estimate against a norm, not a fact. For machines that work the fields 12 to 14 hours a day in season, saving on the sensor does not pay.
Nobody opens the reports
The most common reason of all. We set up a daily summary in Telegram for the agronomist and a weekly one for the manager: hectares, idle time, consumption, deviations. Five figures instead of fifty pages of report.
The signal drops out in the field
In the lowlands by the Kura and in the foothills, Azercell and Bakcell coverage can be patchy. The tracker keeps points in memory and sends them on once the network comes back, so the track is not broken. But at those moments the live view will lag behind, and the dispatcher should know that.
What usually changes in the first season
Fuel consumption per hectare
In our deployments consumption usually falls by 15 to 25%: fuel drains, unproductive runs and engine idling while parked all disappear. The exact figure depends on how disciplined the fleet was before the fitting.
Honest area figures
Operators start being paid for hectares actually worked rather than hectares claimed. In the first month the gap between the foreman's report and the track is often 5 to 15%.
Fewer repeat treatments
Missed patches and overlaps are visible as soon as the machine leaves the field, not when the crop comes up. The agronomist sends a machine back to finish the plot the same day.
No unauthorised trips
A tractor leaving the farm's own fields, or working at night with no assignment, arrives as a notification. Ploughing a neighbour's plot for cash becomes noticeably harder.
Fleet utilisation
You can see which tractors stand idle half the day and which are being worked into the ground. That is an argument when deciding whether to buy another machine or redistribute the ones you have.
Servicing by engine hours
Engine hours are counted automatically, so servicing is planned against actual work. Fewer sudden breakdowns at the height of harvest, when every day a combine harvester stands still is expensive.
The foreman's tally sheet or the track in Wialon
What changes when the hectares are counted by the system rather than reported verbally.
| Tally sheet | GPS monitoring | |
|---|---|---|
| Area based on the actual pass | No, as reported | Yes, from track and width |
| Missed strips and overlaps visible | No, only when the crop comes up | Yes, on the field map |
| Litres per hectare per machine | No, only for the store as a whole | Yes, with a fuel level sensor or CAN |
| It is known who did the work | As the foreman tells it | Yes, from the operator's card |
| Trips outside the schedule are visible | No | Yes, with a notification |
Fitting and cost
The feature becomes available once you are connected to the GPS.az platform. The cost is made up of the hardware, the fitting and a monthly subscription, which includes the SIM card traffic — the total depends on the type of vehicle and the set of sensors. We prepare an exact quote for your fleet free of charge within one working day.
- 1 Your enquiry and the list of vehicles
- 2 The quote and an agreed fitting schedule
- 3 Fitting the hardware at your own site
- 4 Setting up reports and alerts in Wialon, and training the dispatcher
Questions about “GPS monitoring of farm machinery and field operations”
Request a call
A specialist will call back and match a solution to your fleet and your task.