
Fleet utilisation rate: idle time and surplus vehicles
How many hours a day your vehicles actually work, and how many they spend parked outside the office. GPS monitoring calculates the utilisation rate for every vehicle, branch and day of the week, so you can decide which machines to cut, redeploy or hire in.
From the data on board to the dispatcher's decision
Tracker
Records ignition, movement, stops and engine hours for every vehicle.
What counts as work
We set schedules and geofences: a stop at the customer is work, a stop at the office is idle time.
Wialon report
Calculates the utilisation rate by vehicle, branch, day of the week and hour.
A decision on the fleet
Cut, redeploy, put into a shared pool or hire equipment in.
Features and tools
Measurement
- Utilisation rate for every vehicle
- Workload by day of the week and by hour
- Engine hours for plant and heavy equipment
Idle time
- Idle time in the yard and at the customer site
- Vehicles kept just in case
- Cost of keeping idle equipment
Decisions
- Comparison of branches and divisions
- Corporate vehicle pool
- The sums: shrink the fleet or hire in
One working day of a 40-vehicle fleet
An illustrative service company in Baku. This is how the day looks in the utilisation report.
- 29 vehicles went out on the road 11 at the depot
Of the 11 left behind, five have not moved since the start of the month. They are the first candidates for sale or for transfer into a shared pool.
- Peak workload of the day 33 out of 40
Even in the busiest hour, seven vehicles are not needed. The size of the fleet is set by the peak, not by an average day.
- Two vehicles at a customer site for 3 hours each work
A stop inside the customer geofence counts as work rather than idle time — that is how the rule is configured.
- Pickup parked outside the office since 09:00 idle 7 h
Assigned to a department head who has been in the office all day. The vehicle follows the person, not the job.
- A trip after the end of the shift off schedule
It is not counted towards utilisation; it goes into a separate list of trips outside the schedule.

What the fleet utilisation rate is and how to calculate it
The fleet utilisation rate shows what share of the available time a vehicle actually worked. If the working day is 10 hours and the vehicle was on the move or on a job for 4 hours, its rate for the day is 40%.
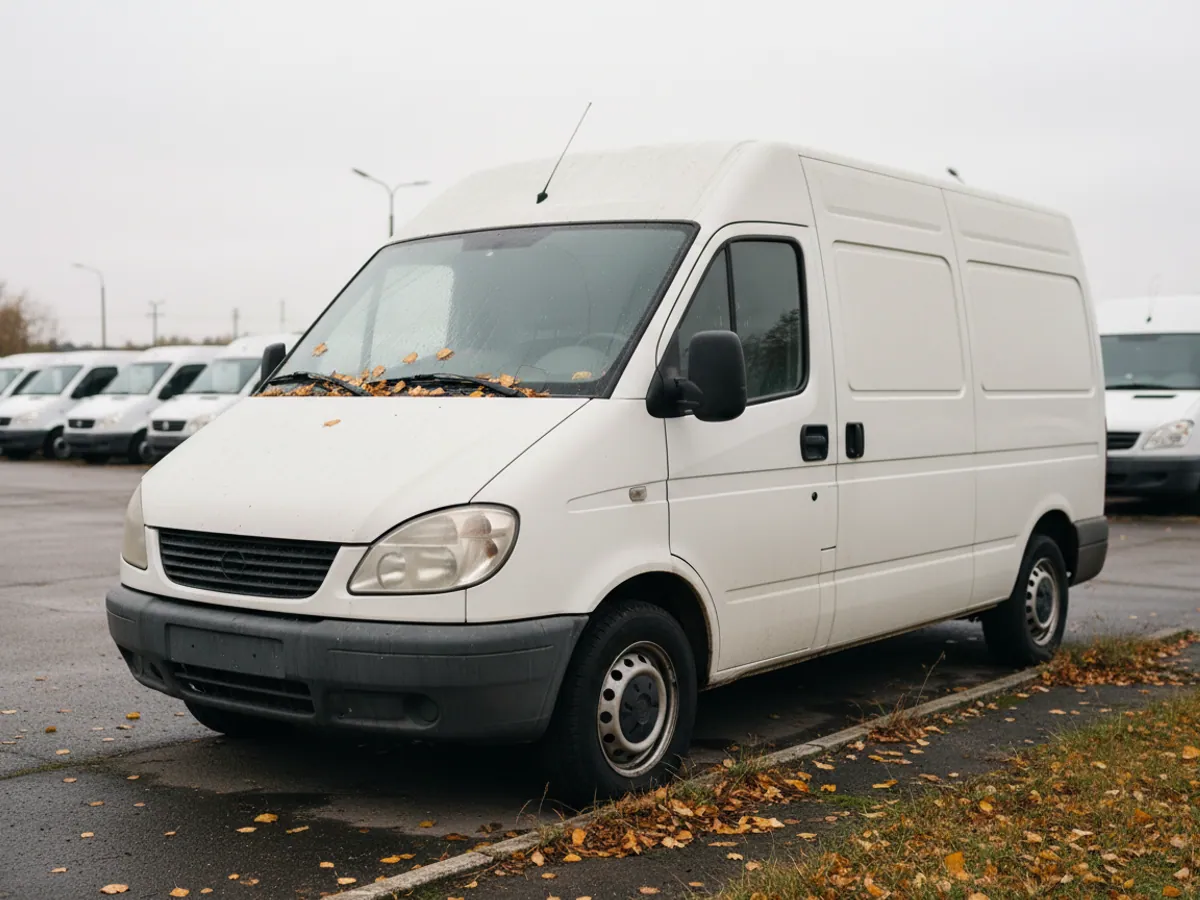
It sounds simple, but everything turns on what you count as work. For a delivery van it is driving and stopping at customers. For an excavator it is engine hours under load. For a company car it is trips during working hours, not the time it spends parked outside an employee's home. That is why we configure the rule separately for each group of vehicles.
The tracker supplies the underlying data by itself: ignition, movement, stops, geofences. From these Wialon builds a report in which every vehicle has working hours, idle hours and a final percentage. For accuracy it matters that the geofences of depots, warehouses and sites are drawn properly, otherwise a stop at a customer and a stop in the office yard will look the same.
Which denominator to choose and how to allow for season and peaks
Rate = working time ÷ available time × 100%. The numerator is nearly always clear. The arguments are about the denominator, and depending on the choice the same vehicle scores 17% or 50%.
- Calendar time — 24 hours × days in the period. Suits round-the-clock equipment: tractor units on long runs, emergency services. For an office car this denominator gives an understated figure and the false conclusion that the vehicle is not needed.
- Working days — the share of days on which the vehicle went out at least once. Crude, but convenient for a first report: it shows straight away which vehicles have stood still for weeks.
- Scheduled working hours — for example 9 hours × working days. The main option for delivery work and mobile crews. Two-shift vehicles have a schedule of their own.
- Hours excluding repairs — working hours minus time in the workshop. That way a vehicle that spent two weeks under repair does not look like a slacker. The repair is recorded separately and appears in a different report.
We write the chosen denominator into the report description and do not change it without warning. Otherwise a rise from 48% to 61% may turn out to be a change of formula rather than an improvement.
Seasonality is the second trap. Grain lorries in summer and in winter, construction equipment in the rainy months, deliveries before the holidays — every business has its own calendar. We compare a month with the same month a year earlier, and we postpone any decision to sell seasonal equipment until the full season is over.
And then there is headroom for peaks. The size of the fleet is set not by an average day but by the busiest hour of the busiest day. We look at how many vehicles are in work simultaneously at the peak over 2–3 months and add headroom for breakdowns and servicing. How much to keep in reserve is the company's decision: an emergency service needs a bigger margin than a delivery operation that can move a drop to another slot. Everything above the peak plus the reserve is a candidate for sale, for the pool or for hire.
What surplus vehicles look like in the report
In almost every fleet of 20 vehicles or more, the first report turns up equipment that works noticeably less than the rest. Usually it is one of four cases.
A reserve kept just in case
The vehicle is held in case the main one breaks down. It goes out two or three times a month, while insurance, parking and tax are charged every day.
Assigned to a person, not to a job
A department head's company car spends 90% of working time in the office car park. Those trips could be covered by a pool or by taxis.
Seasonal equipment out of season
Grain lorries after the harvest, water bowsers in winter, snow ploughs in summer. They can be hired out or temporarily taken off the road.
Imbalance between branches
In Baku there are not enough vehicles and hire is being paid for, while in Ganja or Shirvan identical ones stand idle. Redeployment is cheaper than buying.
The angles from which to look at fleet utilisation
Workload by day of the week
The day-of-the-week report often breaks the familiar picture. A manager is sure there are not enough vehicles, and it turns out they are short only on Mondays and Fridays, when the retail chain's orders peak. On the other days a third of the fleet stands still.
The question is then no longer how to buy two more vehicles, but how to cover the peak days: move some of the deliveries, take short-term hire for the peaks, agree different delivery windows with customers.



How it works out in practice: 40 vehicles, of which 33 are needed
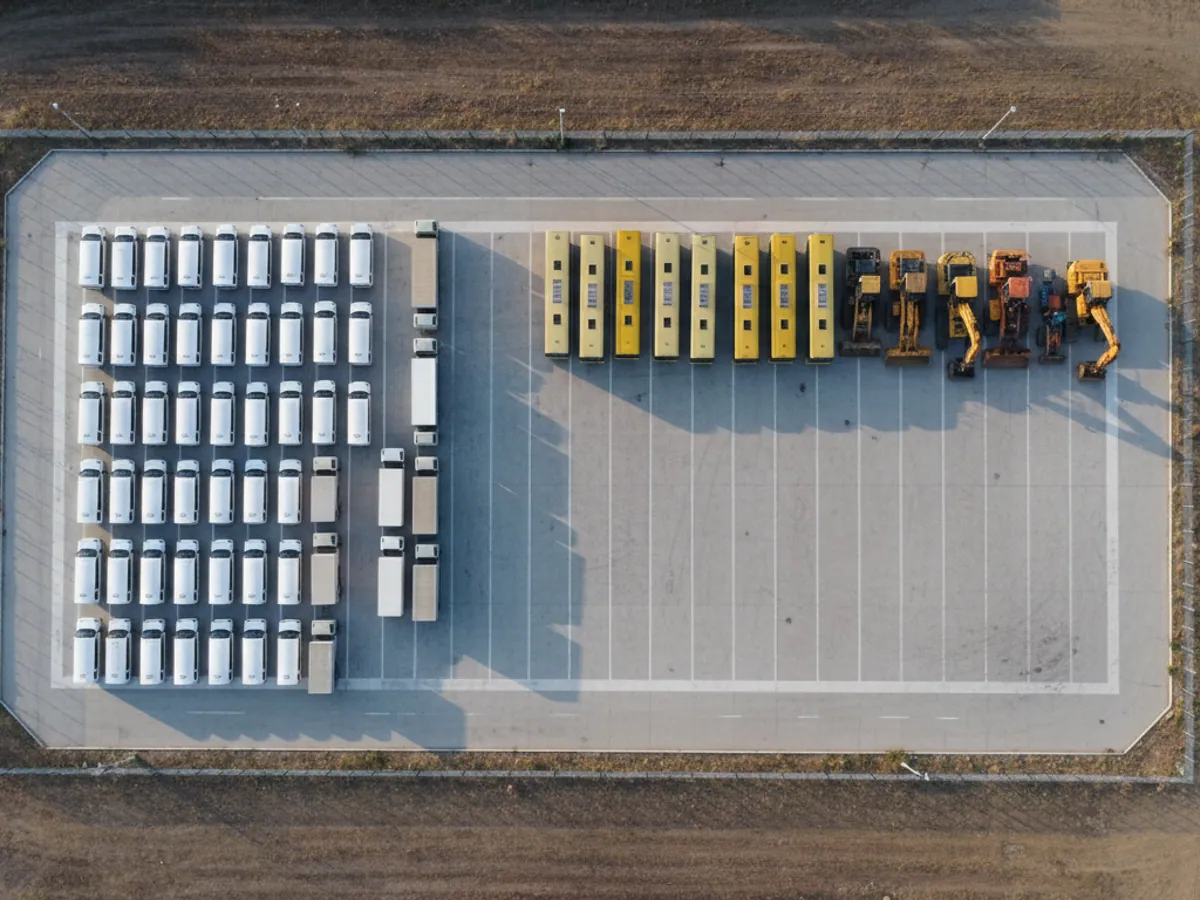
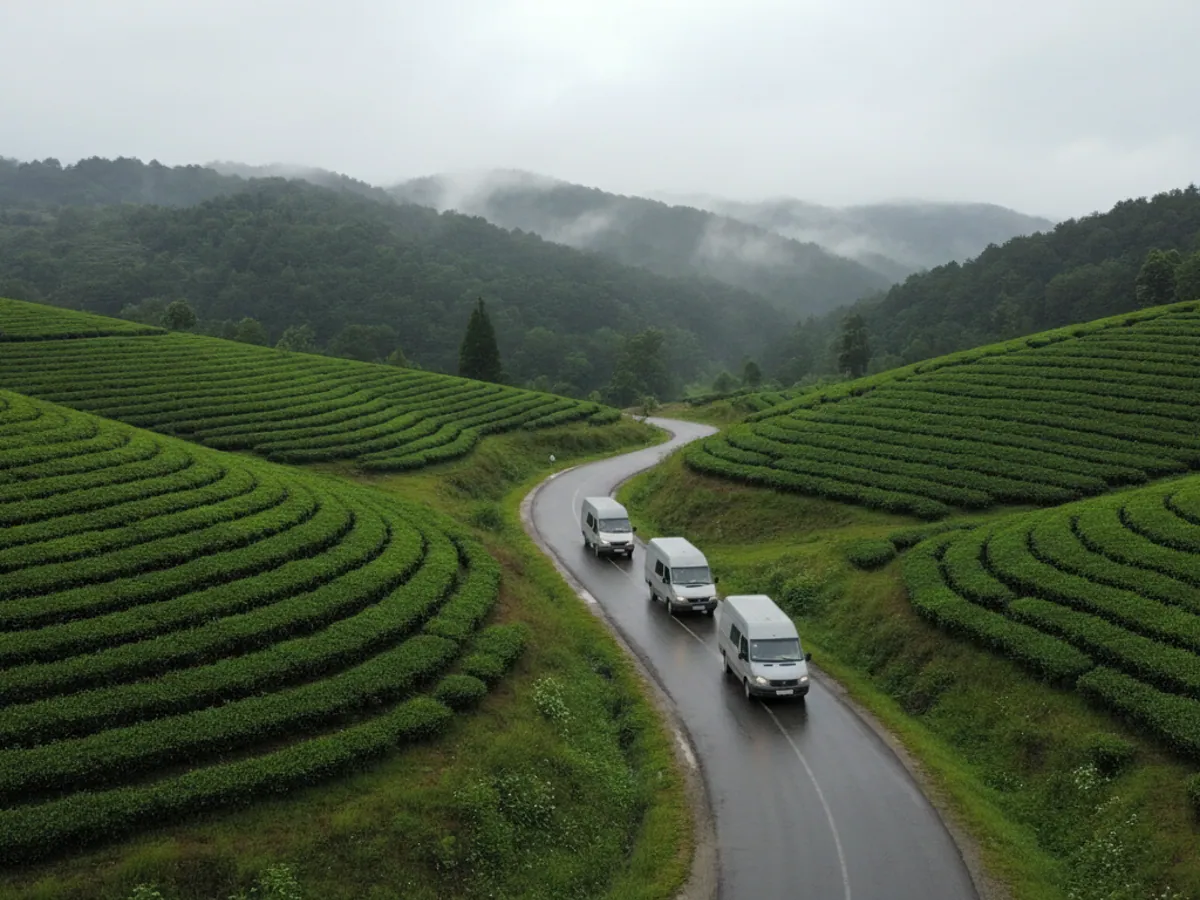
Take an ordinary service company on the Absheron peninsula: 40 vehicles, mobile crews, customer jobs across the whole peninsula. Management is about to buy five more vehicles, because the crews are waiting for transport.
A two-month report says something else. The average utilisation rate across the fleet is 52%. Seven vehicles work less than 20% of the time: three are assigned to site managers, two are listed as reserve, two are waiting for repairs that nobody is chasing. And the crews really are waiting for transport, but only in the morning, between 8 and 10, when everyone sets off at once.
The decision ends up being the opposite of the original one. The purchase is put off, the two reserve vehicles are sold, the site managers' company cars go into a shared pool, and the crews' departures are staggered by 30–40 minutes. The figures in this example are illustrative, but this pattern comes up constantly in the deployments we do.
The decisions usually taken on the strength of utilisation data
Shrinking the fleet
Vehicles with a consistently low rate are sold or handed back to the lessor. The saving is on insurance, tax, parking, servicing and subscription fees.
Hiring instead of buying
If the shortage only occurs on peak days or in season, short-term hire works out cheaper than owning a vehicle that stands idle for 8 months of the year.
Redeployment
Moving equipment between branches and sites. For construction companies this is often the quickest source of surplus vehicles.
A shared pool instead of assigned vehicles
Company cars are booked for a trip rather than assigned to an employee. One vehicle covers the needs of three or four people.
Hiring out your own equipment
Idle plant and heavy equipment can be hired out to contractors, and monitoring will show how much it worked and where while with the hirer.

Honestly, about what the report will not show
The utilisation rate is about time, not about usefulness. A vehicle can drive all day and still carry a half-empty load space. Or stand for half a day at a customer because installation work is going on there, and that is normal work, not idle time.
So we do not advise cutting the fleet on the strength of a single figure. Before deciding, it is worth also looking at how full the load space is, where that can be measured (with axle load sensors, for instance), at the revenue per vehicle and at the peak days. Sometimes a low rate is a deliberate reserve for an emergency service, and it is justified.
If you need help with the conclusions, our specialists run a fleet optimisation consultation: they go through the reports with you and put forward options with the sums worked out. And for hire companies, where utilisation translates directly into revenue, there are separate solutions for hire and leasing.
How we set up the utilisation report
Groups and working schedules
We split the fleet into groups by type of work and give each its own schedule: one shift, two shifts, round the clock, weekends. Available time is calculated from the schedule.
Geofences for depots and sites
We draw the yards, warehouses, customer sites and the addresses where vehicles are kept overnight. Without this the report cannot tell work at a site from idling in the yard.
The rule for what counts as work
Movement, the engine running on site, attached equipment switched on — for each group we choose the appropriate indicator and a time threshold.
A weekly mailing
The utilisation summary reaches the manager by email on Monday morning: the top idle vehicles and a comparison of branches, without logging into the system.



Sell, hire in or pool together
Three typical decisions about surplus vehicles. The utilisation report suggests which one fits.
| Sell | Hire in | Shared pool | |
|---|---|---|---|
| When it fits | Stands idle for months | Needed seasonally | Used occasionally |
| Frees up money | Yes, immediately | Yes, no costs while idle | Partly |
| Vehicle to hand at the peak | No | By arrangement | Yes, through booking |
| No new rules for staff | Yes | Yes | No, a policy is needed |
| What to look at in the report | Vehicles with no trips | Peaks by season | Workload by hour |
Fitting and cost
The feature becomes available once you are connected to the GPS.az platform. The cost is made up of the hardware, the fitting and a monthly subscription, which includes the SIM card traffic — the total depends on the type of vehicle and the set of sensors. We prepare an exact quote for your fleet free of charge within one working day.
- 1 Your enquiry and the list of vehicles
- 2 The quote and an agreed fitting schedule
- 3 Fitting the hardware at your own site
- 4 Setting up reports and alerts in Wialon, and training the dispatcher
Questions about “Fleet utilisation rate: idle time and surplus vehicles”
Request a call
A specialist will call back and match a solution to your fleet and your task.