
Fleet optimisation consulting
We work out the cost of a kilometre and of an engine hour for every vehicle, using GPS monitoring data, fuel records and repair costs. The result is a report with a baseline, a list of measures and an estimate of the effect of each one, together with the caveats it depends on. Decisions about selling vehicles or changing bonuses remain with management.
A cost-of-ownership model for every vehicle and a final report: the baseline, the areas of loss that were found and a prioritised list of measures. For each measure we state the expected effect, the way to measure it and the conditions under which the calculation stops holding.
What a kilometre in your fleet actually costs
Most fleet owners in Baku know how much they spent on fuel last month. Far fewer can say straight away what one kilometre in a particular van costs, how many hours a day each tipper really works, and whether the company needs all 40 vehicles when half of them are standing idle by lunchtime.
Fleet optimisation consulting answers those questions with figures. We gather GPS monitoring data, fuel records, repair costs and drivers' wages, bring them into a single model and show where the money goes. The result is a list of specific decisions with an estimate of the effect of each: which vehicles to sell, which routes to merge, where to introduce consumption norms and how to reward drivers.
In our experience, in fleets where nobody had previously calculated the cost of a kilometre, a first audit finds a noticeable share of costs that can be removed without losing any work. We put a figure on that share only after going through your own data: in a fleet with well-organised record keeping it will be more modest than in one where nobody has counted the cost of a kilometre.
How the work goes, step by step
Tracks and costs
At least two weeks of monitoring data, costs over 6–12 months, interviews with the dispatcher and the drivers.
Cost of ownership
Cost per kilometre and per engine hour for each vehicle, utilisation, and the outliers among identical machines.
Measures and effect
A prioritised list of measures, each with an effect in litres, hours or manats and a way of measuring it.
A meeting with management
We answer the finance lead and the workshop manager. The report is accepted once the measures and the way of measuring them are agreed.
Checking against the baseline
Optionally, once a month we compare the figures with the baseline and adjust the reports in Wialon.
How an optimisation project runs
An illustrative example: a distributor with 30 vans across Baku and Absheron, with monitoring already in place.
- Access to Wialon and exports from the accounts department data gathering
Fuel, repairs, tyres, insurance, fines and drivers' wages for the past 6–12 months.
- Interviews with the dispatcher and the drivers processes
They know better than anyone where the process sticks: which routes are awkward and why vehicles are standing by lunchtime.
- Five vans work less than 3 hours outlier
Before proposing that vehicles be withdrawn, we check whether the audit period happened to fall in the lull before a seasonal peak.
- The report is presented to management plan of measures
Idling, merging routes, going through consumption with three drivers, a bonus for consumption below the norm.
- Checkpoint: idling is creeping up old habits
In the first month everyone tries; by the third the old habits are back. We see it in the report and discuss it with the workshop manager.

Where a fleet loses money that the accounts do not show
The accounts department sees the totals: so much on diesel, so much on parts, so much on wages. The losses hide inside those totals, and a profit and loss statement will not find them.
Here is what we find most often:
- Surplus vehicles. A fleet grows just in case, and the tracker data shows that some of the units are used for less than three hours a day, and until the audit nobody in the fleet knows how many. Every one of them still costs insurance, inspection, parking and depreciation.
- Idling. In the Baku summer drivers keep the engine running for the air conditioning. On a van that is 1–1.5 litres an hour; on a bus or a tractor unit, up to 3 litres.
- Excess mileage. The gap between planned and actual distance on urban routes is usually 8–15%. Some of it is traffic and diversions, some of it is private journeys.
- Repair on failure. When servicing is scheduled not by engine hours and mileage but by breakdown, the repair bill grows and the vehicle stands idle for a week instead of a day.
- Opaque incentives. A driver who drives carefully is paid the same as one who burns 20% more fuel.
Taken one at a time these are trifles. Added up across a fleet of 30 vehicles they come to a sum comparable with the wages of several drivers.
How the project runs, week by week
Gathering the data
We connect to your monitoring system (or fit trackers if there are none) and collect at least two weeks of actual data: tracks, mileage, engine hours, fuel level, idle time.
In parallel we ask the accounts department and the workshop manager for costs over the past 6–12 months: fuel, repairs, tyres, insurance, fines, drivers' wages. We interview the dispatcher and two or three drivers — they know better than anyone where the process sticks.
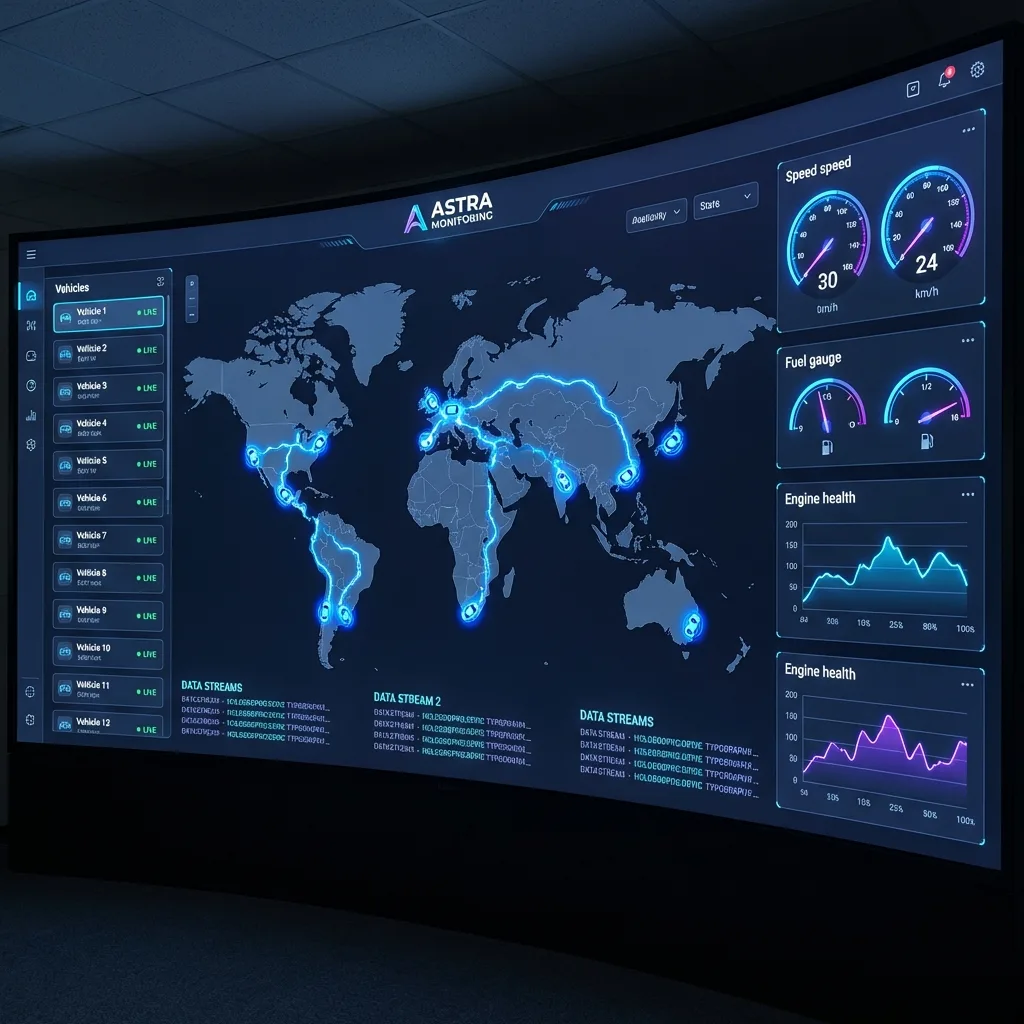


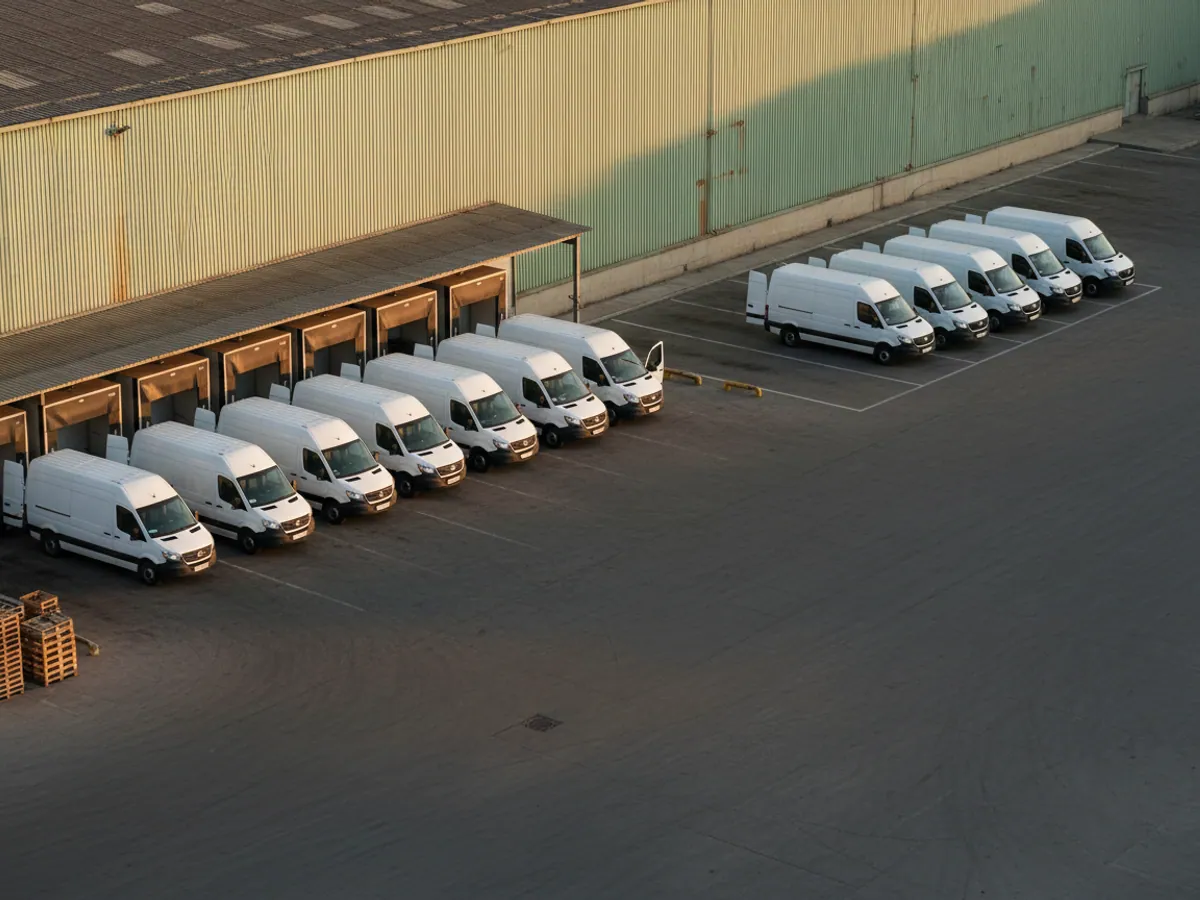
A worked example: 30 delivery vans in Baku
Take a typical distributor's fleet: 30 vans working across Baku and Absheron, averaging 120 km a day, 26 working days a month.
What two weeks of data show:
- Idling — on average 1 hour 40 minutes a day per vehicle. At 1.2 l/h that is about 2 litres a day, or roughly 1,500 litres a month across the whole fleet.
- Five vans work less than three hours a day. Their routes can be shared out among the rest without overtime.
- Consumption per 100 km differs by 18% between drivers on identical vehicles. A noticeable share of the excess comes down to three drivers, but before speaking to them we check whether their routes, loads and the mechanical condition of their vehicles differ.
What we propose: an idling rule with a notification, merging routes and withdrawing five vehicles from the fleet (sale or hire out), going through consumption with the three drivers using the charts, and a bonus for consumption below the norm.
The fuel saving is counted in litres and compared against the baseline. Withdrawing five vehicles removes their fixed costs entirely. It is decisions of that kind — what to cut, rather than where to save a couple of litres — that usually produce most of the effect.
What we look at first
The set of metrics depends on the type of fleet, but there are five figures we start from almost every time:
Cost per kilometre and per engine hour
All the costs of a vehicle divided by the distance or the hours it actually delivers. The headline figure for comparing vehicles, routes and buy-or-hire decisions.
Utilisation rate
How many hours of the working shift the vehicle is genuinely in use. Below 50% is grounds for asking whether it is needed in the fleet at all.
Share of idling
The percentage of time with the engine running and the vehicle stationary. For urban vans normal values are up to 15%; we often see 25–35%.
Deviation from the consumption norm
The gap between the norm and the actual figure for each vehicle and each driver. It reveals mechanical problems, driving style and possible fuel drains alike.
Repair costs per 1,000 km
Helps you spot the vehicles it is time to sell: when repairing an old van starts to cost more than the lease payment on a new one.
What you are left holding
A cost model for every vehicle
A cost-of-ownership table you can update yourself. There is more on how this works on the page about fleet cost accounting.
Consumption norms by model
Calculated from your own actual data with allowances for season and route type, rather than taken from the vehicle's data sheet.
Configured reports in Wialon
Reports on utilisation, idling and consumption aligned with the new KPIs. Where non-standard formats are needed, we build them under the custom reports service.
A prioritised action plan
A list of measures with owners, deadlines and expected effect. It is clear what to start with on Monday.
Recommendations on fleet size
Which vehicles to withdraw, which to replace, where hiring works out better. The basis is data on the utilisation of each unit.
A driver incentive scheme
A draft policy on bonuses for consumption, accident-free driving and keeping to schedule, tied to the monitoring data.
How the final report is put together
The baseline
The actual figures for the audit period: mileage, engine hours, consumption, idle time and costs for each vehicle. We state separately which data came from the trackers, which from the accounts department, and where we had to rely on an estimate.
Normalisation
To compare fairly, we bring the baseline to comparable conditions: consumption per 100 km and per engine hour, utilisation per working shift, allowances for season and route type. Vehicles are compared within the same model and the same kind of work.
Measures and effect
Every measure comes with an expected effect in litres, hours or manats, an owner and a deadline. The effect is calculated from the normalised baseline rather than from the worst month.
Limits of the calculation
For every estimate we write down what it depends on: changes in haulage volume, fuel prices, the make-up of the fleet, the season. If the audit period did not include a seasonal peak, that is noted, and the conclusion about surplus vehicles is presented as provisional.
The scope of the work and acceptance of the report
Included
Gathering and checking the data, interviews, the cost model, the report with its plan of measures, and the presentation of the report to management.
Not included
Carrying out the measures with our own people, decisions about staff, selling vehicles and negotiating with leasing companies. Support during the changes is arranged as a separate stage.
How the report is accepted
Your accountant or workshop manager checks the baseline for each vehicle, and we take any comments on board before the presentation. The report is treated as accepted after the meeting at which management has agreed the list of measures and the way the effect will be measured.
When consulting is not worth it
We will say plainly in which cases a full project will not pay for itself.
If the fleet is 3–5 vehicles and you see every one of them every day, GPS trackers and a couple of simple reports will most likely be enough. Start with basic monitoring, then look at the data three months later.
If you already have a strong logistics lead who costs the kilometre and maintains the norms, consulting will deliver less than the average example promises. In that case a rapid audit makes more sense: two weeks, a short report with 10–15 points.
And one last thing. If management is not ready to change processes — to withdraw surplus vehicles or revisit the bonuses, say — the report will stay in a folder. We would rather say so at the first meeting than sell work that will produce no result.
For the technical choice of equipment and platform there is a separate service, telematics consulting. This project is about the economics of the fleet.
The results clients usually get
Fuel in litres, not in percentages from an advert
Once norms, idling control and bonuses are in place, we count the reduction in consumption in litres per 100 km and per engine hour against the baseline. Across our projects the spread is wide: it depends on how fuel was controlled before the audit.
Fleet size set by utilisation
Once utilisation has been calculated, vehicles you can manage without often come to light. How many there are, and whether to withdraw them, is decided by the seasonal peaks rather than by a single month.
Planned rather than reactive repairs
Servicing by actual engine hours and mileage instead of repair after a breakdown. Fewer unplanned stoppages and fewer urgent purchases of parts.
Payback on your own figures
How long it takes to recover the cost of the consulting and the implementation depends on the size of the fleet and on which measures you decide to adopt. You can sketch out your own case in advance with the savings calculator.
Rapid audit or full project
We choose the format according to the size of the fleet and how well record keeping is organised.
| Rapid audit | Full project | |
|---|---|---|
| Duration | Two weeks | 3–4 weeks |
| Deliverable | A report with 10–15 steps | A cost model and a plan of measures |
| Discussion | One meeting | A presentation to management |
| When we choose it | Small fleet, strong logistics lead | Nobody has costed a kilometre |
Questions about “Fleet optimisation consulting”
Request a call
A specialist will call back and match a solution to your fleet and your task.