
Bespoke GPS monitoring reports
We build Wialon reports and dashboards around a specific question: consumption, idle time, cost per kilometre, late arrivals at delivery points. First we agree where every figure comes from, then we build a mock-up on last month's data. The quality of a report depends on the source data: without a calibrated fuel level sensor and driver identification, some of the figures will be approximate.
A report template, a scheduled mailing or a dashboard that answers one question agreed in advance. It comes with a metric dictionary: how each column is calculated and which source it draws on. We hand a report over when its figures for the check period agree with what the mechanic and the accountant see.
A report people read rather than file away
Wialon has dozens of standard tables and charts. But the director does not need a 40-column table covering each of 60 vehicles. He needs one thing: where the money went this month and who is answerable for it. The garage manager needs to know which vehicles are due for servicing. The dispatcher needs to know who was late to site today.
We build bespoke GPS monitoring reports for a specific person and a specific question. We take the data from Teltonika and Queclink trackers, fuel level sensors, the CAN bus and driver keys, and assemble from it a report that gets opened every morning.
Sometimes that is a template in Wialon with the right columns and grouping. Sometimes it is a dashboard for the director, with consumption, idle time and violations by branch on a single screen. And sometimes it is an export into Power BI or into your accounting system, if your analysis already lives there.
How the work goes, step by step
Which decision the report serves
Who opens the report and what they decide from it: a driver's bonus, selling a vehicle, the maintenance plan.
Columns and sources
For every figure, a source: GPS, CAN, fuel level sensor or driver key. The client sets the highlighting thresholds.
Checking the source data
Fuel level sensor calibration, the trip detector, driver identification. We put these right before any calculation.
Built on last month
We show it to whoever will use it. After the first viewing we usually take out half the columns.
Reconciliation and distribution
The figures for the check period match the accounts or are explained. We set up the mailing or the export.
How a refuelling report comes about
An illustrative example: reconciling refuelling against fuel cards for a distributor in Baku, 35 vehicles.
- Meeting with the garage manager and the accountant brief
The decision the report serves is a deduction from the driver when there is a discrepancy. The highlighting threshold is 5% of the volume refuelled.
- On four vehicles the fuel level sensor is uncalibrated data
The fuel charts are sawtoothed. Those vehicles are left out of the report for now and recalibration is planned.
- Mock-up on last month's data mock-up
The accountant asks for engine hours to come out and the fuel card number to go in.
- On the Gazakh road: 250 l on the card, 190 in the tank discrepancy
The line is highlighted, with the filling station coordinates and a fuel chart that can be shown to the driver.
- Sent out every Monday at 8:00 handed over
The totals for the check month matched the accounts, and the metric dictionary was handed over.
Where work on a report starts
We do not start with a template. The first question is always the same: what decision will you take once you have looked at this report?
If the answer is that a driver loses his bonus over fuel drains, then what is needed is a report on drains with coordinates, times and a fuel chart that can be shown to the driver. If it is a decision about whether to sell the older tippers, then what is needed is a summary of cost per kilometre and idle time for each vehicle over six months.
Next we work out where each figure comes from. Mileage — from GPS or from the CAN odometer? Consumption — from the fuel level sensor or from the CAN fuel counter? Engine hours — from the ignition or from engine revolutions above 500 rpm? Those choices decide whether the report will agree with what the mechanic sees.
Then we build a mock-up on last month's data and show it to whoever is going to use it. Almost always half the columns come out after the first viewing.
Examples of the reports we build most often
Reconciling refuelling against fuel cards
Columns: vehicle, driver, date, filling station, litres from the receipt or card, litres from the fuel level sensor, difference, coordinates. Lines where the difference is over 5% are highlighted.
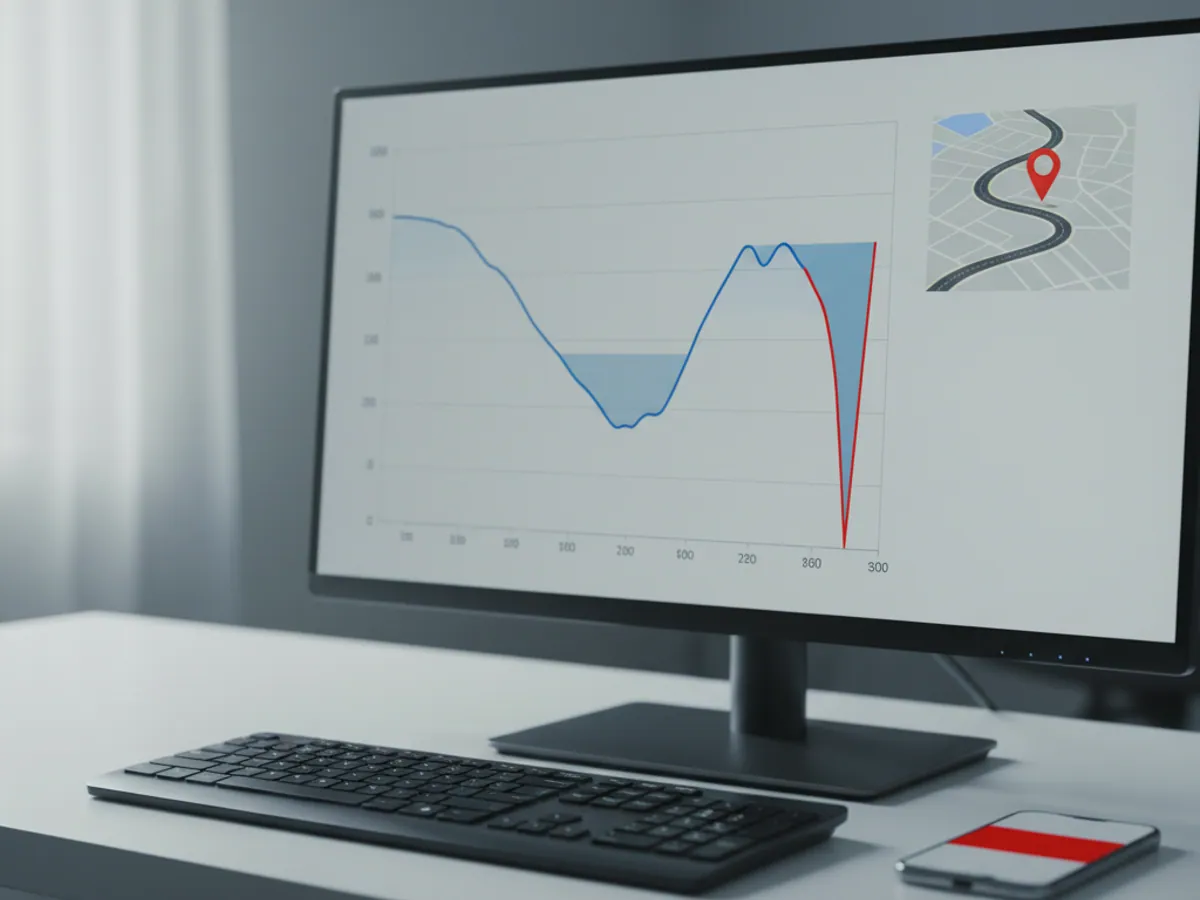
From experience: a fill-up on the Baku to Gazakh road, 250 litres on the card, 190 into the tank. The report shows that on Monday morning rather than a quarter later at stocktaking. More on sensors on the fuel control page.
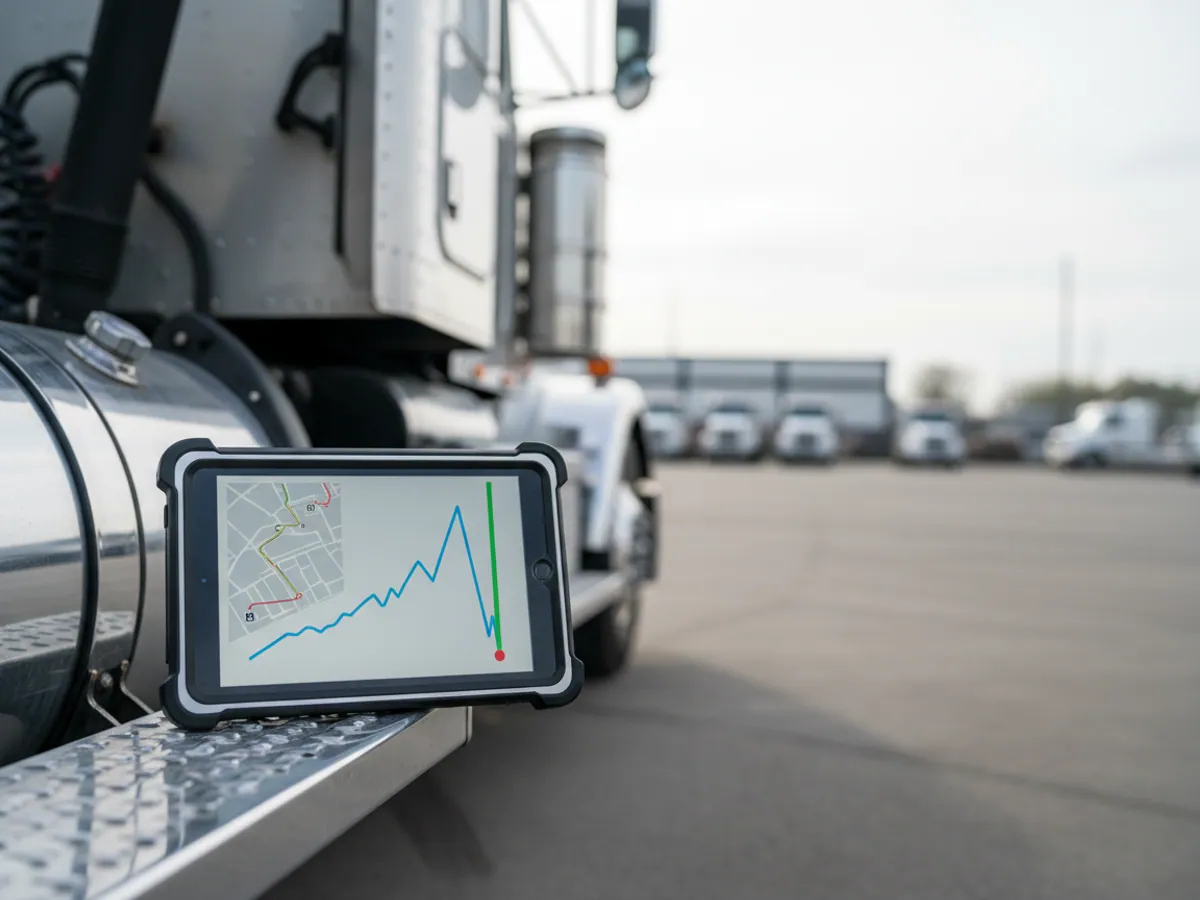
A sample brief for a report
Question and recipient
Who opens the report and what they decide from it. For example: the garage manager, once a week, decides which vehicles go in for servicing.
Units and period
Which vehicles or groups the report covers, over what period it is built, and how it is grouped: by vehicle, driver, branch or day.
Columns and sources
The list of columns, and for each of them a source: GPS, CAN, fuel level sensor, driver key, an external export. Where a figure could come from two places, the choice is recorded here.
Thresholds and highlighting
Which deviations are picked out and from what size: a difference between the fill-up and the card, the amount left before servicing, a late arrival. The client sets the thresholds; we point out where they will produce false alarms.
Format and delivery
A template in Wialon, Excel or PDF by email, a dashboard or an export to BI. When it arrives and to whom, and in which time zone the day is counted.
The check period
The month whose data is used to verify the mock-up, and the person who confirms that the figures agree with their own records.
The metric dictionary: what we settle before any calculation
Mileage
From the GPS track or from the CAN odometer. GPS loses points in tunnels and where the signal is poor; the odometer depends on tyre size. The report states which option was chosen.
Engine hours
From the ignition, from revolutions above a set threshold, or from CAN. For equipment that stands for long periods with the ignition on, the options diverge noticeably.
Idle time
A stop longer than a set period, counted separately with the engine running and without. We pick the threshold to suit the type of work: it is different for a courier in central Baku and for a tipper in a quarry.
Refuelling and drains
A change in level on the fuel level sensor greater than a threshold within a set time. The accuracy depends on the calibration and on the shape of the tank; events below the threshold do not reach the report.
Cost per kilometre
Total costs for the period divided by mileage. Which costs are included (fuel, repairs, tyres, leasing) is for the client to decide, and it goes into the dictionary.
Scope of work and sign-off of the report
Included
Working through the task, the report brief, checking the source data and the unit settings, a mock-up on a past period, revisions after comments, and setting up the mailing or the export.
Not included
Fitting and calibrating equipment where the data does not exist, building BI models on the client's side, and keeping your records for you. Those are quoted separately.
Acceptance criteria
The report builds without errors for every unit in the brief, the columns are calculated as recorded in the metric dictionary, and the totals for the check period agree with the client's records or the differences are explained. The recipient confirms that they are using the report.
The forms in which we hand over the analysis
The same set of data can be presented in different ways. We choose by who will look at it and how:
A report template in Wialon
Opened in go.gps.az, exported to Excel or PDF. It suits dispatchers and garage managers who work in the system anyway.
A scheduled mailing
The report arrives by email at 8:00 or at the end of the week. The director does not have to log in — the summary comes to him.
A director's dashboard
One screen with 8-12 measures: consumption per 100 km, idle time, violations, runs completed. With filters by branch and by period.
Export to BI and ERP
The data goes through the Wialon API into Power BI, a data warehouse or an accounting system, where your analyst builds the reports.
A notification instead of a report
Sometimes a report is not wanted at all. If what is needed is a reaction to a single event — a sharp drop in fuel level, say — a notification on Telegram or by email is more convenient. We pick the threshold to suit the tank volume and the accuracy of the calibration: with an uncalibrated fuel level sensor such notifications will fire falsely.
Why the figures in a report sometimes do not match reality
A report is only as good as the data beneath it. We check that data before building any analysis and say plainly if a report cannot be built as things stand. The usual causes of discrepancies:
- An uncalibrated fuel level sensor, or a tank that was changed after it was fitted. The fuel charts come out sawtoothed and the report finds drains that never happened. The cure is recalibration — see fitting and calibrating fuel level sensors.
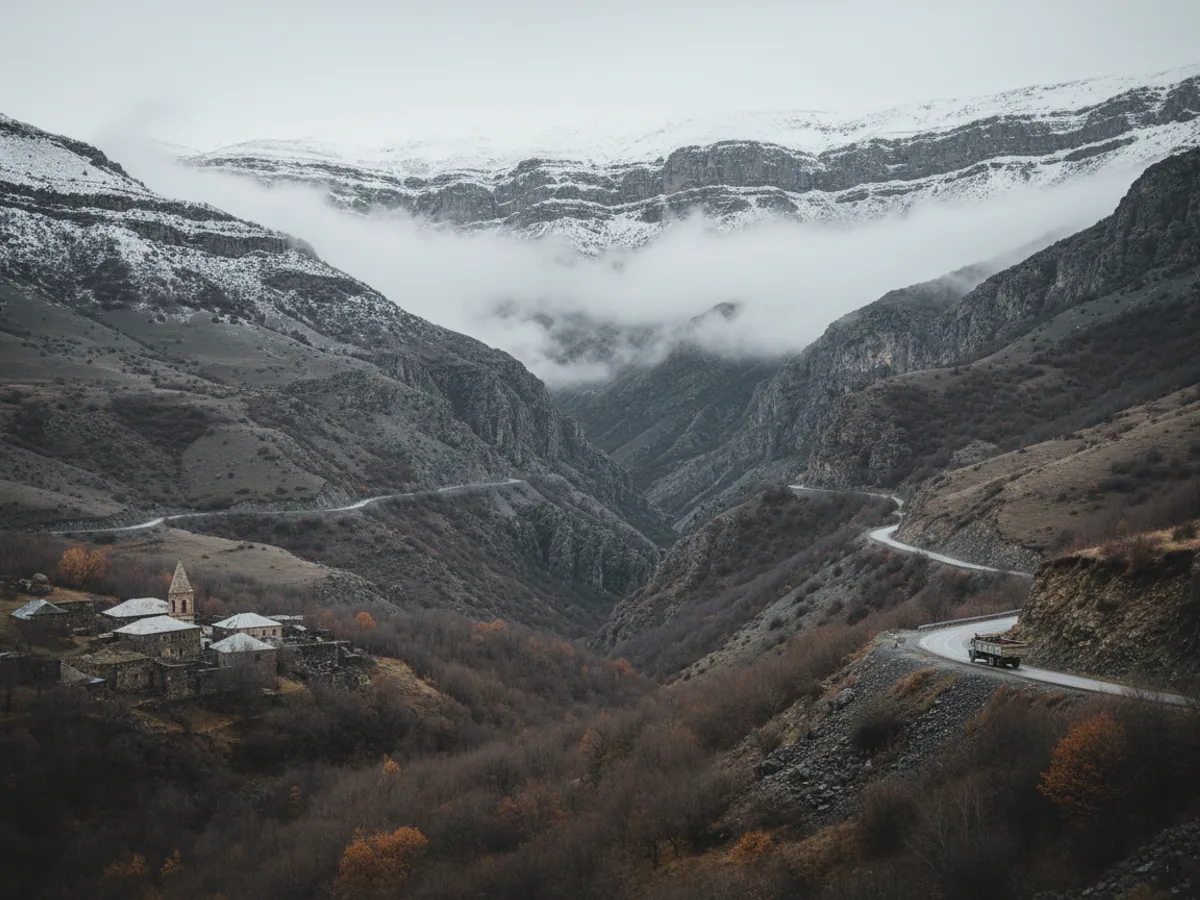
- Gaps in coverage. In the mountains beyond Guba or around Dashkesan the tracker works from memory and sends the data on later. A report built before that catch-up will show a hole in the track.
- The wrong trip detector. If a stop of five minutes counts as parking, a courier vehicle in central Baku will have 80 trips a day.
- No driver identification. Without iButton or RFID keys a report by driver is built from the shift rota, and rotas change in practice.
We put these things right in the system settings before handing a report over.
Timescales and what we need from you
A simple report on data that is already there — a summary of mileage and fuel with your own grouping, for instance — takes 3-5 working days. A complex report with calculation logic behind it — cost per kilometre, reconciliation against fuel cards, billing — takes 2-3 weeks including agreeing the mock-up and checking it on real data. A dashboard for the director usually takes 2-4 weeks.
What we will need from you:
- an example of the report you use today, even if it is an Excel file put together by hand;
- the person who will use the new report and can say this is not what I meant;
- consumption norms, rates, shift rotas — everything that goes into the calculations;
- if data from other systems is needed (fuel cards, repairs), an export from them.
After hand-over the report stays with us: if you add new vehicles or change the norms, we will adjust the template.
The price depends on how involved the calculations are and how many reports there are, not on the size of the fleet. The same template works just as well on 15 vehicles as on 300. We quote after the first meeting, once it is clear which data exists and what is missing.
What good analysis gives you
Losses are visible at once
Fuel drains, padded mileage and private trips surface on Monday rather than at the annual audit. How much surplus consumption will turn up is not something anyone can say in advance: it depends on how closely the fleet was watched before.
Decisions on figures
Selling a vehicle, revising a norm, changing a route — based on cost per kilometre and utilisation rather than on impressions.
Less work by hand
A report the finance officer spent two days assembling in Excel now arrives by email on its own.
Something to argue with
With a driver, a customer or a retail chain — behind every figure there is a track and a chart that can be shown.
In what form we hand over the analysis
The format is chosen around who will look at the data and how.
| Template in Wialon | Emailed on a schedule | Dashboard | Export to BI or ERP | |
|---|---|---|---|---|
| Who it suits | Dispatcher, garage manager | Director | Director, branches | Analyst |
| Arrives without logging in | No, opened in go.gps.az | Yes, Excel or PDF | No | Yes, into your system |
| One screen across all branches | No | No | Yes, with filters | Depends on your BI |
| Alongside data from other systems | No | No | No | Yes, Power BI or ERP |
Questions about “Bespoke GPS monitoring reports”
Request a call
A specialist will call back and match a solution to your fleet and your task.