
Fleet cost accounting and total cost of ownership (TCO)
What a kilometre of each vehicle really costs: fuel, servicing, tyres, parts and fines pulled into a single picture on top of GPS monitoring data. You can see which vehicles are dragging the budget down and when it is time to decide — repair or sell.
From the data on board to the dispatcher's decision
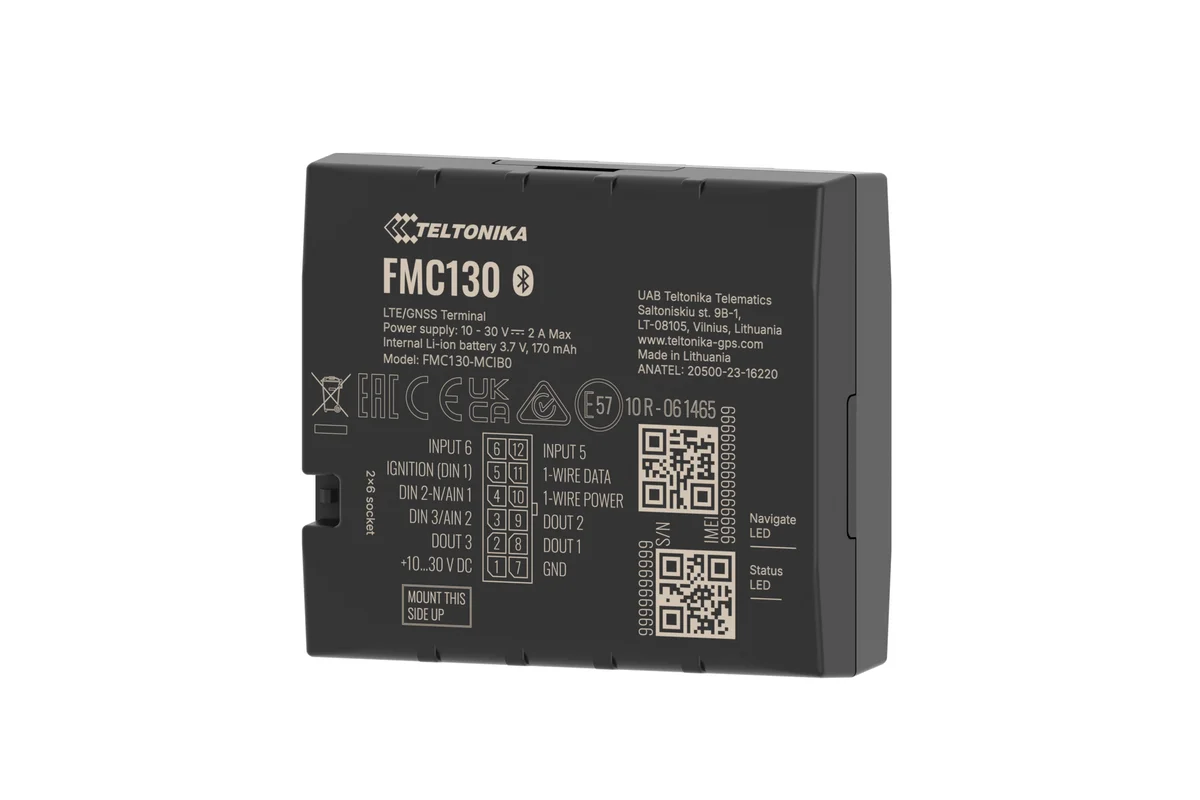
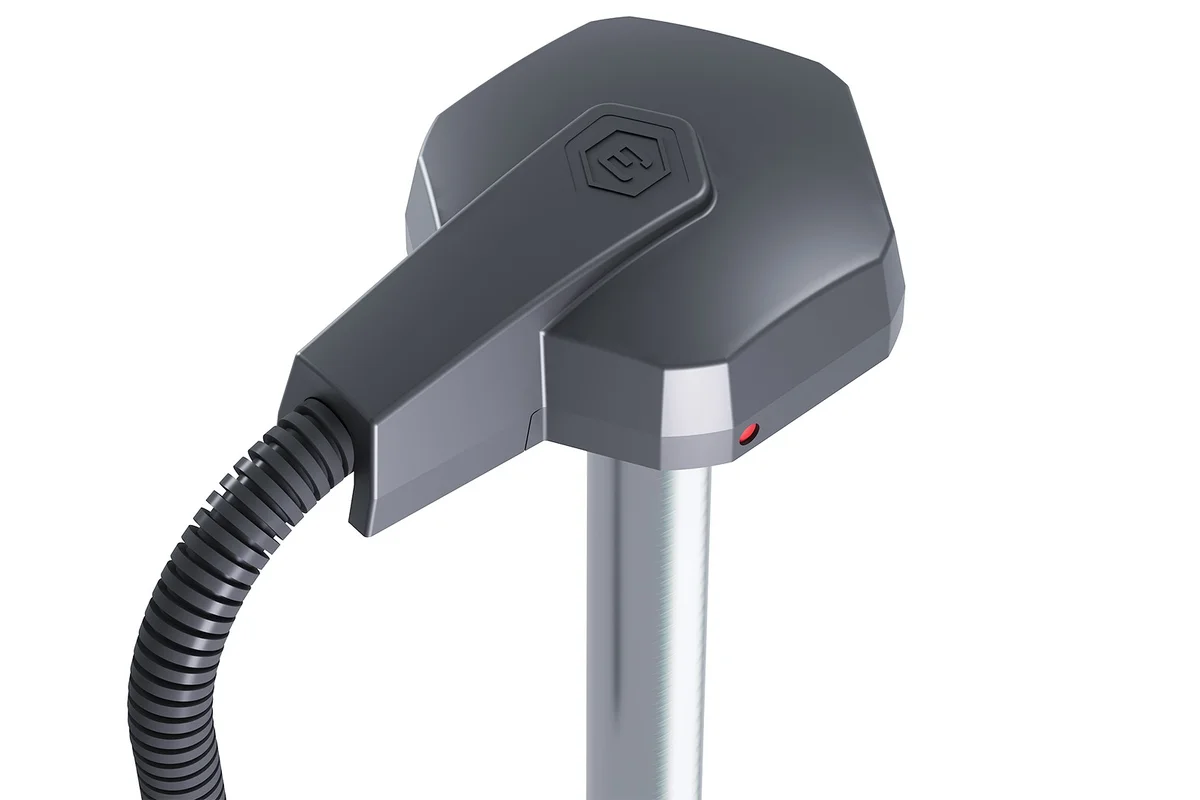
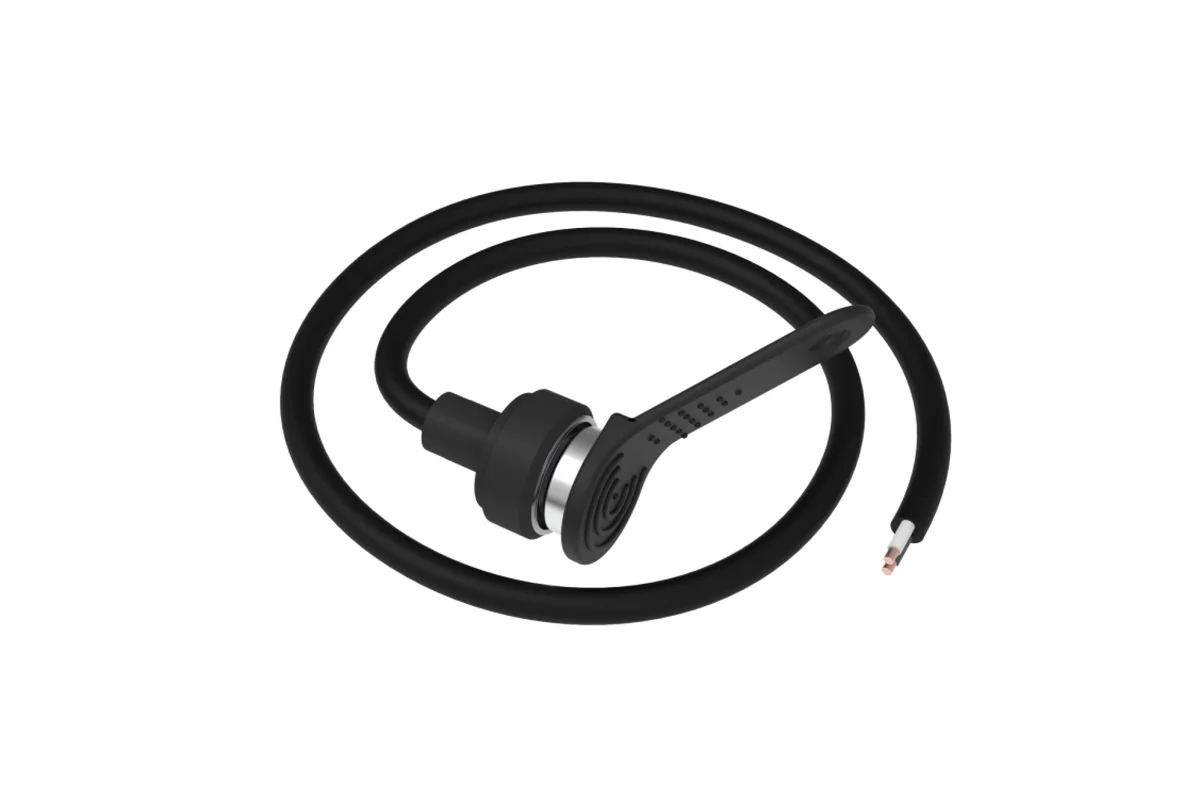
Tracker and fuel level sensor
Mileage, engine hours, refuelling and drains are recorded automatically, with no waybills.
Invoices and repairs
Repairs, tyres, insurance and fines go into the vehicle record or arrive from 1C.
A Wialon report
Divides the spend by real mileage and engine hours and compares identical vehicles.
A decision on the vehicle
You can see which vehicle is getting expensive: repair it, move it to another site or sell it.
Features and tools
Cost lines
- Fuel: refuelling, drains and actual consumption
- Scheduled servicing and repair history
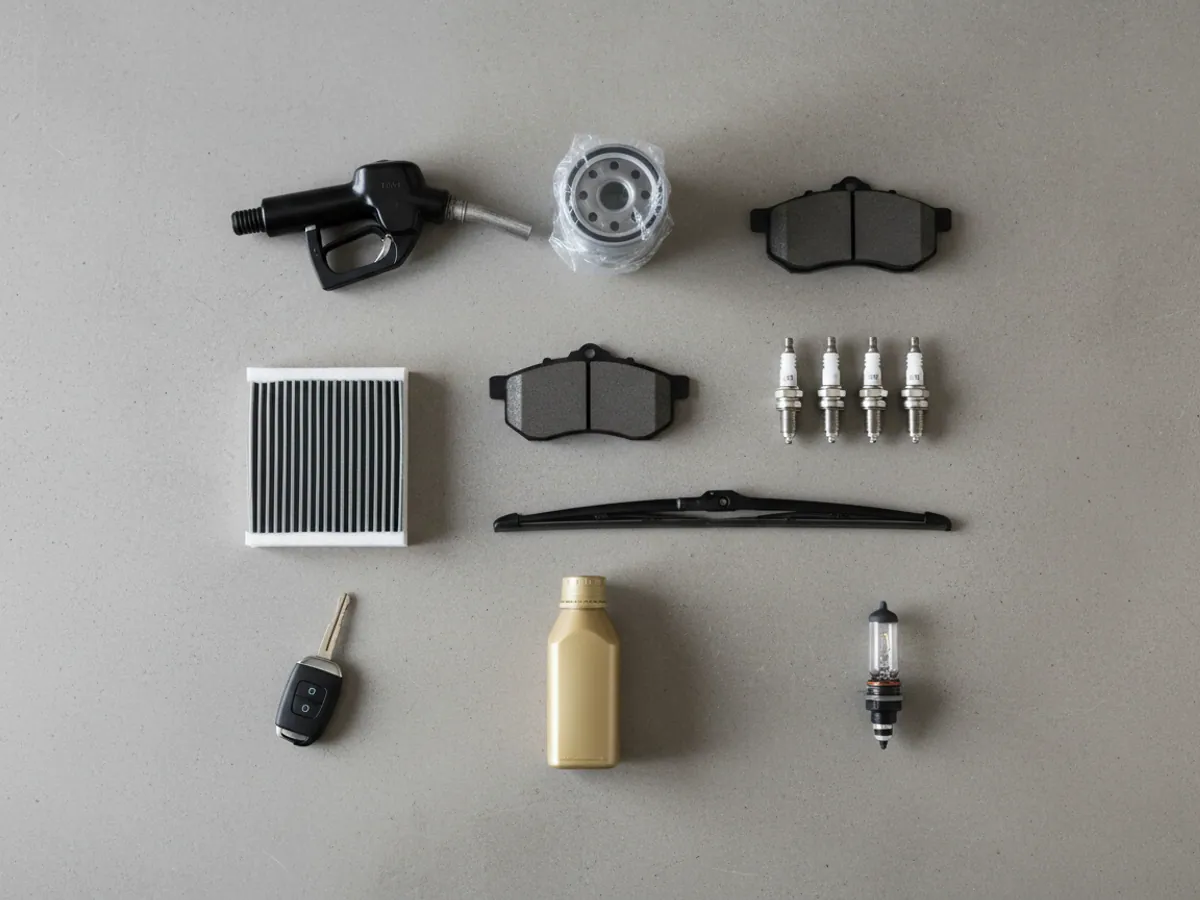
- Tyres, batteries and consumables by mileage
- Fines and accidents tied to the driver
Comparison
- Cost per kilometre and per engine hour for every vehicle
- Comparing identical vehicles within the fleet
- Idle time and under-used equipment
Decisions
- Exporting costs to 1C and Excel
- Reports written for the finance director
- The repair-or-sell decision
What lands in the cost column over a single day
An illustrative tipper on a site in the Garadagh district. Every event of the day is a line in the cost of ownership.
- Leaves the depot in Lokbatan shift start
Mileage and engine hours come from the tracker; the driver fills in nothing by hand.
- Refuelling at a filling station +180 l
Litres from the fuel level sensor go into the fuel cost line and are checked against the fuel card.
- Engine running while parked idling 1 h 10 min
Engine hours accrue, mileage does not. That is fuel and engine life with no useful work behind it.
- Speeding on the motorway a fine to come
The fine will arrive later, but the event is already tied to a driver and a date — there will be somewhere to book the amount.
- 400 km left until scheduled servicing service due
The cost of the service will land in the vehicle record and in the cost of its kilometre.

Why the accounts department does not know what one vehicle costs
In the books everything is filed by cost line: fuel and lubricants in one place, parts in another, tyres in a third, and fines usually go through petty cash altogether. The total for the fleet is known down to the last qapik. But the question of what this particular Hyundai HD78 costs us per month normally stops everyone in their tracks.
Fleet cost accounting in GPS.az is built around the vehicle rather than around the cost line. The tracker supplies mileage, engine hours and fuel consumption, the service history supplies repairs and replacements, and the fuel card export supplies refuelling. What comes out the other end is one plain figure: the cost per kilometre for a lorry or a car and the cost per engine hour for plant and heavy equipment.
That figure is more honest than any fleet average. Two identical Ford Transits bought in the same year can, three years on, differ in cost per kilometre by half as much again: one works Baku traffic on short legs, the other runs the M-2 to Ganja and hardly ever stands still. As long as they are counted together, the difference stays invisible.
All of this rests on accurate fuel and mileage data. That is why we almost always bring cost accounting in together with fuel control and maintenance records.
What the cost of ownership is made of
The largest line, and the one that leaks most easily
For a goods fleet, fuel is usually somewhere between a third and half of all running costs. It is also where most of the losses hide: drains, refuelling into a jerrycan, receipts for litres that never reached the tank.
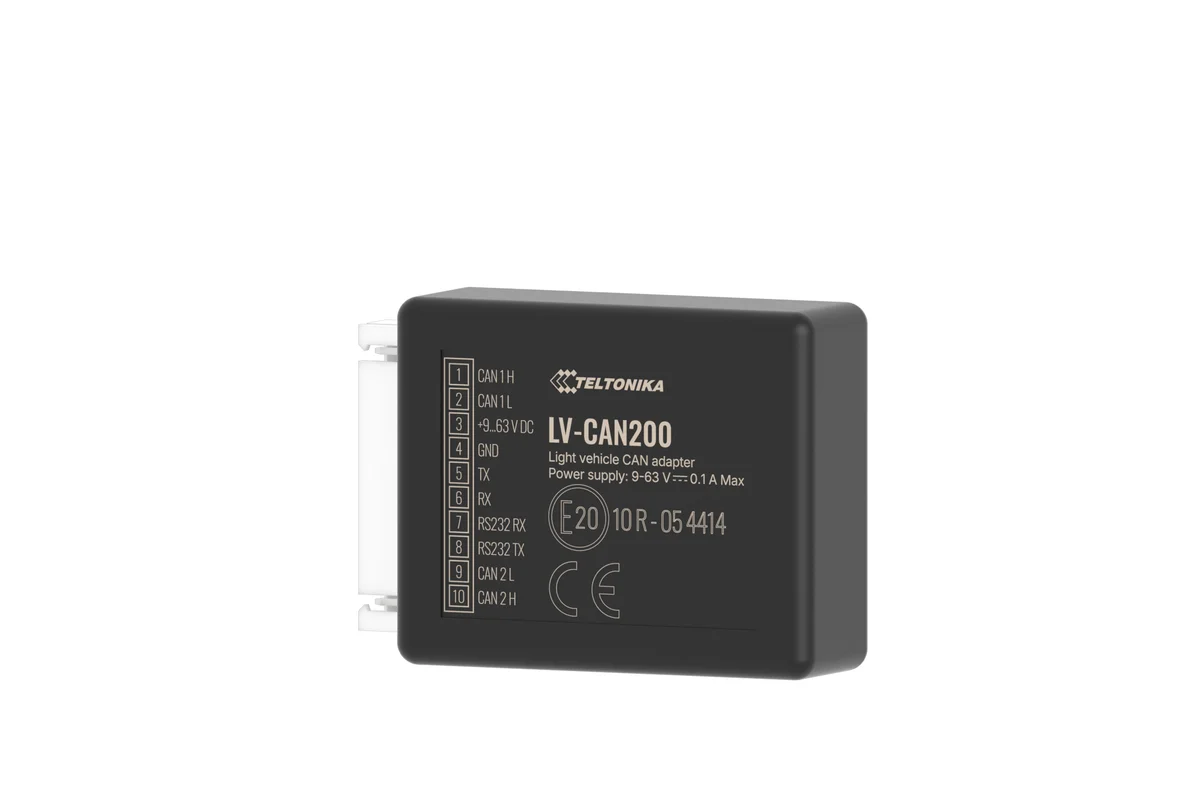
For cost accounting what matters is not consumption per 100 km on its own, but reconciling three sources: how much was paid for on the card or the receipt, how much actually went into the tank according to the fuel level sensor, and how much was burnt according to the CAN bus or the fuel level sensor. The gap between the first and the second is money that went past the vehicle.
If a vehicle has no fuel level sensor, we count by CAN or by the norm. The accuracy is lower, but the cost per kilometre still comes out far closer to the truth than it would from waybills.


What the cost reports show
Cost per kilometre and per engine hour
The total spend for the period divided by the GPS mileage or by the engine hours. For a mixed fleet — both figures, each for its own type of equipment.
Cost structure for a vehicle
The shares taken by fuel, repairs, tyres, fines and everything else. It is immediately clear what exactly makes a particular vehicle expensive.
Comparison with its neighbours in the fleet
Vehicles of the same model and the same year side by side in a table. The outliers stand out without an analyst: if five Isuzus have a similar cost per kilometre and the sixth is 40% higher, something is wrong with it.
Month-by-month trend
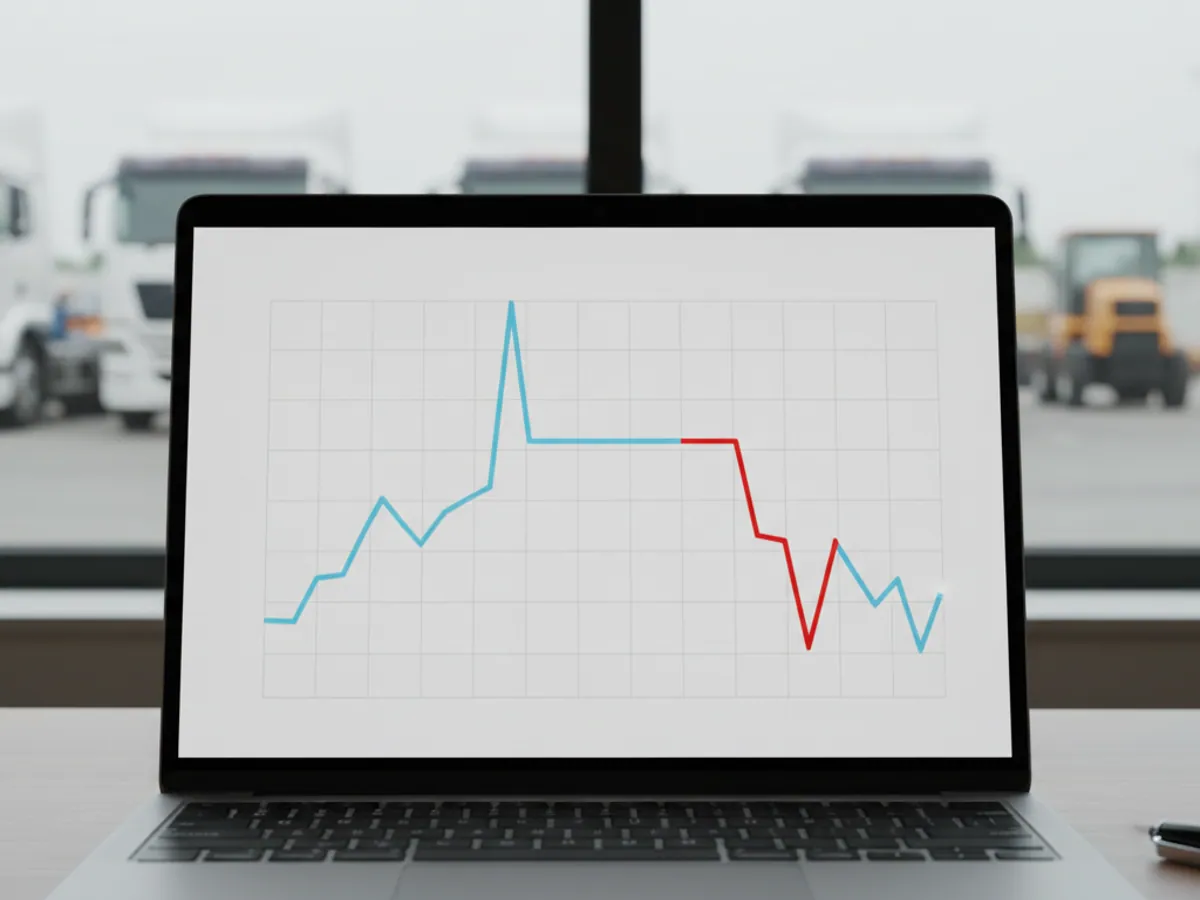
The rise in repair costs as a vehicle ages shows up clearly on a chart covering a year or two. It makes budgeting for the next season straightforward.
Costs by division and by site
If vehicles are assigned to branches, construction sites or contracts, the spend can be broken down along those lines and billed internally.
The cost of vehicles that stand idle
Insurance, parking and depreciation accrue while a vehicle is standing still as well. The report shows how much the fleet pays for equipment that barely works.
Where each cost line comes from
Before counting the cost per kilometre, we agree where each figure comes from. The tracker covers only some of the lines; the rest come from the accounts. We draw up this table of sources together with the accounts department and the workshop manager at the outset.
Fuel
The source is the fuel level sensor or CAN for actual consumption, and the fuel card export for the amount in manats. If there is no sensor, litres are counted by the norm and the line is marked in the report as calculated.
Servicing and repairs
The source is the vehicle's service record or work orders from 1C carrying the registration number. Without that number a repair disappears into general fleet costs and never reaches the cost per kilometre of a particular vehicle.
Tyres and consumables
The source is the date and cost of fitting a set plus the tracker mileage between changes. The cost is spread over the kilometres covered rather than written off in full in the month of purchase.
Fines and accidents
The source is the penalty notices and insurance claims, entered by hand. The time of the offence is checked against the track so that the cost can be tied to a vehicle and a driver.
Fixed costs
Insurance, taxes, parking, the monitoring subscription. They are entered once a year or once a month and spread across the periods in equal shares.
Depreciation
Taken from the accounts department on whatever method your company already uses. We do not recalculate it; we only spread it across the months and add it to the cost of ownership as a separate line.
The formula for cost per kilometre and per engine hour
The formula itself is simple. The cost per kilometre in manats is the sum of all spend on the vehicle for the period divided by the GPS mileage over the same period. For plant and heavy equipment we divide by engine hours instead of kilometres.
- AZN/km = (fuel + servicing and repairs + tyres and consumables + fines + fixed costs + depreciation) ÷ tracker mileage, km.
- AZN/engine hour = the same spend ÷ engine hours from the ignition or from an engine-running sensor.
Three agreements, without which the figures for different months are not comparable. We take a period of no less than a month: a one-off repair inside a short period makes the kilometre implausibly expensive. Major repairs can be spread over several months, but the rule for spreading them is fixed in advance. We show depreciation as a separate line, because for the repair-or-sell decision people often want to look at it apart from real cash.
With incomplete data we are open about it. If a vehicle has no fuel sensor for the month, the report counts litres by the norm and flags that it did. If the tracker was without power for a few days, the mileage for those days is understated and the cost per kilometre is overstated — such a vehicle is marked in the report rather than compared with the rest on equal terms. If no repairs were entered for a vehicle, we do not substitute a fleet average; we show an empty line. An empty line is more honest than an invented figure.

Repair or sell: how to reach the decision on the numbers
The most common argument in a fleet is what to do with an old vehicle. The mechanic says it has a few years left in it, the finance side sees the repair invoices. When there is a cost history, the argument is easier to settle.
An example from a typical situation. A distributor in Sumgait has six identical vans from 2016–2017. Over a 12-month report, five of them hold their cost per kilometre within the same band, while on one the repairs over the year ate more than half its market value: a gearbox, two turbochargers, constant small trips to the workshop. Plus 23 days out of service, during which its routes were covered by hired vehicles.
In cases like this the decision is no longer made on gut feeling. We usually suggest looking at three things:
- the cost per kilometre over the last 6–12 months and the direction it is moving;
- the repair spend relative to the vehicle's residual value;
- the days spent standing in the workshop and what covering for them costs.
If all three are rising, the vehicle will only get more expensive from here. The report does not take the decision for you, but the conversation with the mechanic gets shorter.
Where TCO calculations usually go wrong
Cost accounting is useful exactly as far as the data is complete. Here is what most often distorts the picture in the first few months.
Mileage is taken from waybills
Hand-written odometer figures get rounded and nudged into shape. Mileage from a GPS tracker does not depend on the driver, so that is the only mileage we use for the cost per kilometre.
Repairs are not tied to a vehicle
Parts are written off to the fleet as a single line. A year later it is impossible to work out where the money went. It is enough to put the registration number on every work order.
Fixed costs get forgotten
Insurance, taxes, parking, the monitoring subscription — small change per month, but on a vehicle that rarely works they are exactly what makes the kilometre expensive.
Comparing the incomparable
A tipper in a quarry and a van around town cannot be measured with the same ruler. Group vehicles by model and by type of work, or the conclusions will be false.
How to bring cost accounting to your fleet
If GPS.az trackers are already fitted, you have most of the data — mileage, engine hours, fuel. What remains is to add the costs the tracker cannot see.
We do that in three steps. First, together with the workshop manager we draw up the list of cost lines: which costs you want to see and in how much detail. Then we set up where they come from: manual entry into service records, importing the fuel card export from Excel, or an exchange with your accounting system. And at the end we assemble the report in the form that is convenient for a manager to read.
For fleets where servicing is kept in a separate system, the data can be passed across automatically through integration with 1C. For small fleets a monthly spreadsheet upload is enough.
The first fully-formed conclusions appear after 2–3 months, once some history has built up. Before that the figures exist, but it is too early to base staffing or purchasing decisions on them. You can get a rough idea of the potential savings in advance in the savings calculator.
Excel built on waybills, or GPS data
The cost per kilometre is only as honest as the mileage you divide the spend by.
| Excel and waybills | GPS and Wialon | |
|---|---|---|
| Mileage with nothing added on | No, as the driver tells it | Yes, from the tracker |
| Engine hours of plant and heavy equipment | By estimate | Yes, from the ignition |
| Fuel drains are visible | No | Yes, with a fuel level sensor |
| Comparing vehicles | Once a year, by hand | Yes, at any moment |
| The cost of idle time | Not counted | Yes, as a separate line |
How to get started
Four steps from your enquiry to reports you can use. We prepare a quote for your fleet free of charge within one working day.
- 1 Your enquiry and the list of vehicles
- 2 The quote and an agreed fitting schedule
- 3 Fitting the hardware at your own site
- 4 Setting up reports and alerts in Wialon, and training the dispatcher
Questions about “Fleet cost accounting and total cost of ownership (TCO)”
Request a call
A specialist will call back and match a solution to your fleet and your task.