
Fleet management on the GPS.az platform
Fleet management on the GPS.az platform means records for every vehicle in a single system: mileage and engine hours from the tracker, fuel from a fuel level sensor or CAN, service intervals and drivers tied to their key. The owner, the fleet engineer, the dispatcher and the accounts department all look at the same fleet, each from their own angle. What data you get depends on the sensors fitted to the vehicles, and what effect you get depends on who in the company works through the reports regularly.
- 07:12 Van 10-TK-214 set off without a driver key
- 09:40 Tipper 90-SN-551: 300 km to scheduled service
- 11:05 Pickup 77-AR-108 arrived at the Sumgait site on schedule
- 13:30 Tractor unit 10-VE-730: engine fault code over CAN
- 21:15 Saloon 99-OK-402 on the move outside working hours
From the data on board to the dispatcher's decision
Tracker and CAN
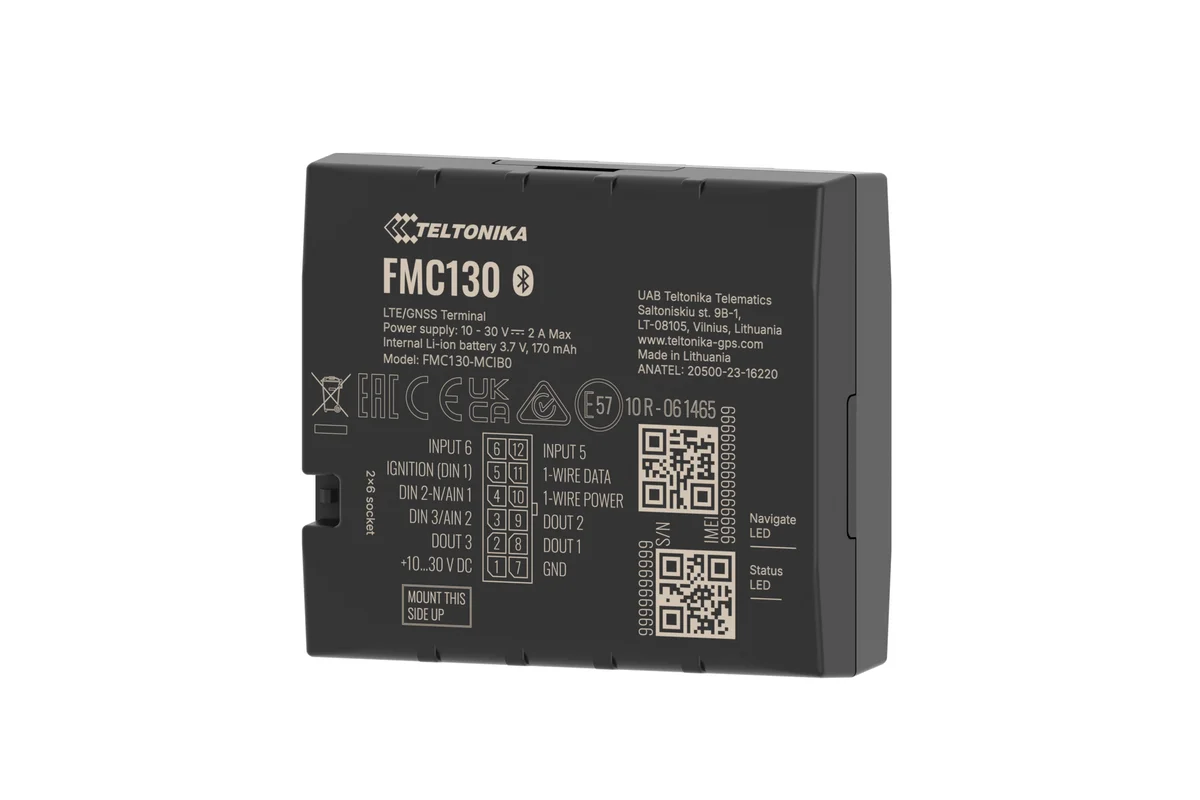
A Teltonika FMC130 or FMB140 picks up coordinates, mileage, engine hours and CAN bus data.
Fuel level sensor and driver key
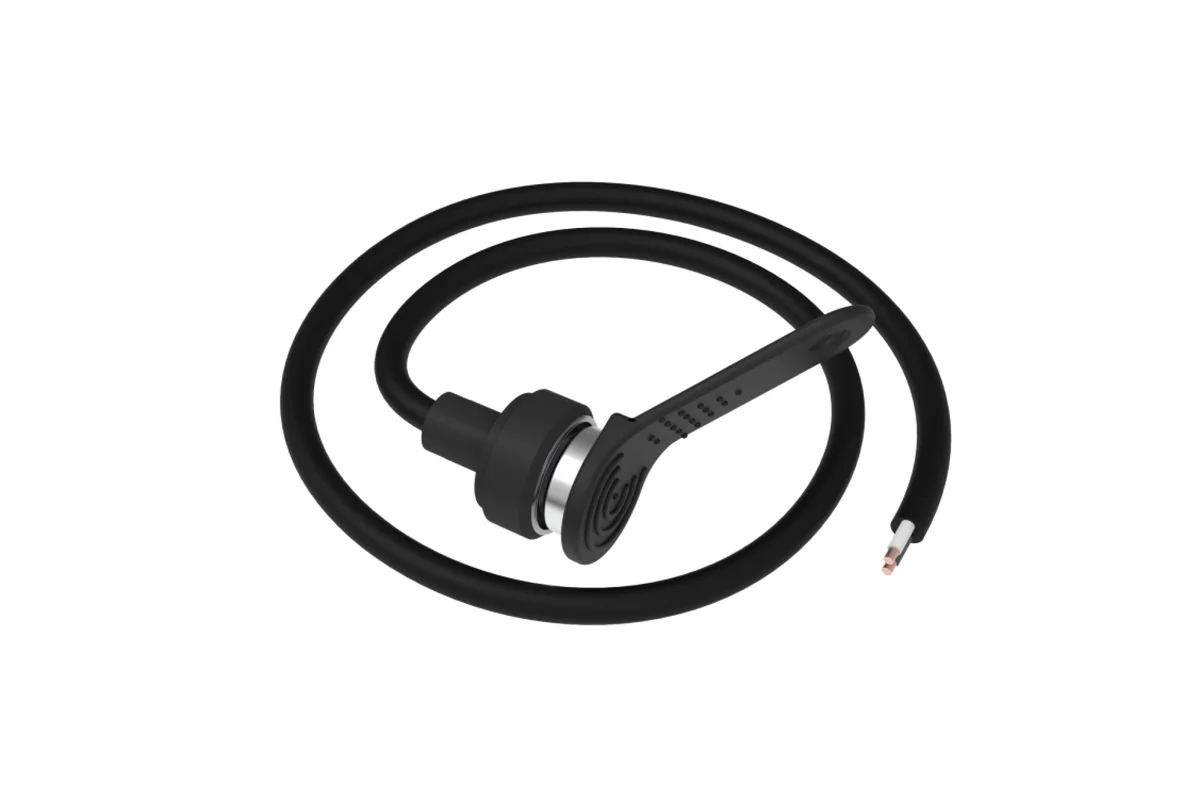
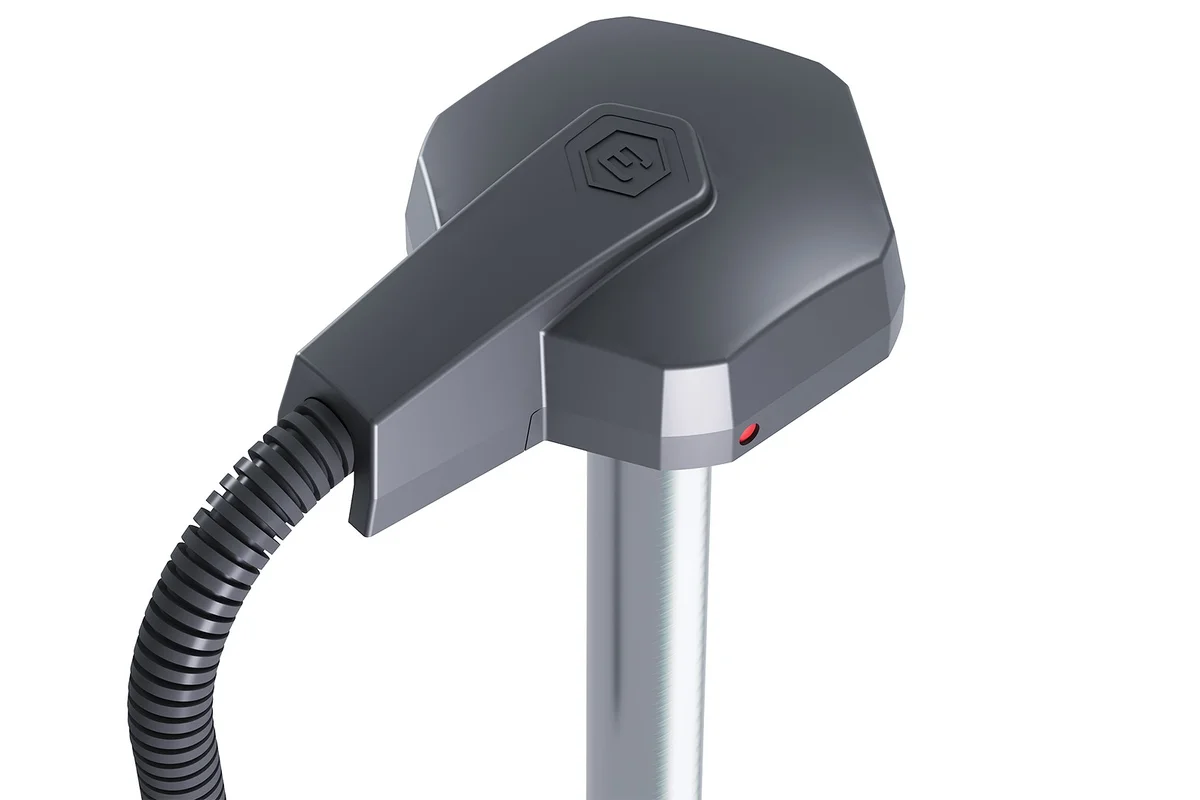
As the job requires we add a fuel level sensor in the tank, an iButton or RFID for the driver, BLE tags on attached equipment.
Wialon Local
Calculates mileage, idle time, fuel, service intervals and a driving score for every vehicle.
Each with their own view
The owner looks at the money, the fleet engineer at the condition of the equipment, the dispatcher at the runs.
Features and tools
Costs
Equipment
One day of a fleet as the system sees it
An illustrative service company on the Absheron peninsula, 25 vehicles. This is how the fleet engineer sees the day's events.
- 22 vehicles out of 25 went out on the road 3 at the depot
Three vehicles were not started today. The utilisation report shows that one of them has been standing for a second week.
- Engine fault from CAN data fault code
The tracker sent a fault code from the on-board computer. The vehicle can go in for repair before it stops on the road.
- Deviation from the route in Khirdalan +14 km
The driver made a detour on personal business. The extra mileage goes into the plan-versus-actual report for the run.
- Mileage and consumption for the day calculated 25 vehicles
The figures for waybills and writing off fuel and lubricants are already in the report — the accounts department does not need to collect paperwork from the drivers.
- Pickup on the move after the shift off schedule
The vehicle is assigned to a foreman whose shift ended at 18:00. The notification reaches the dispatcher straight away.
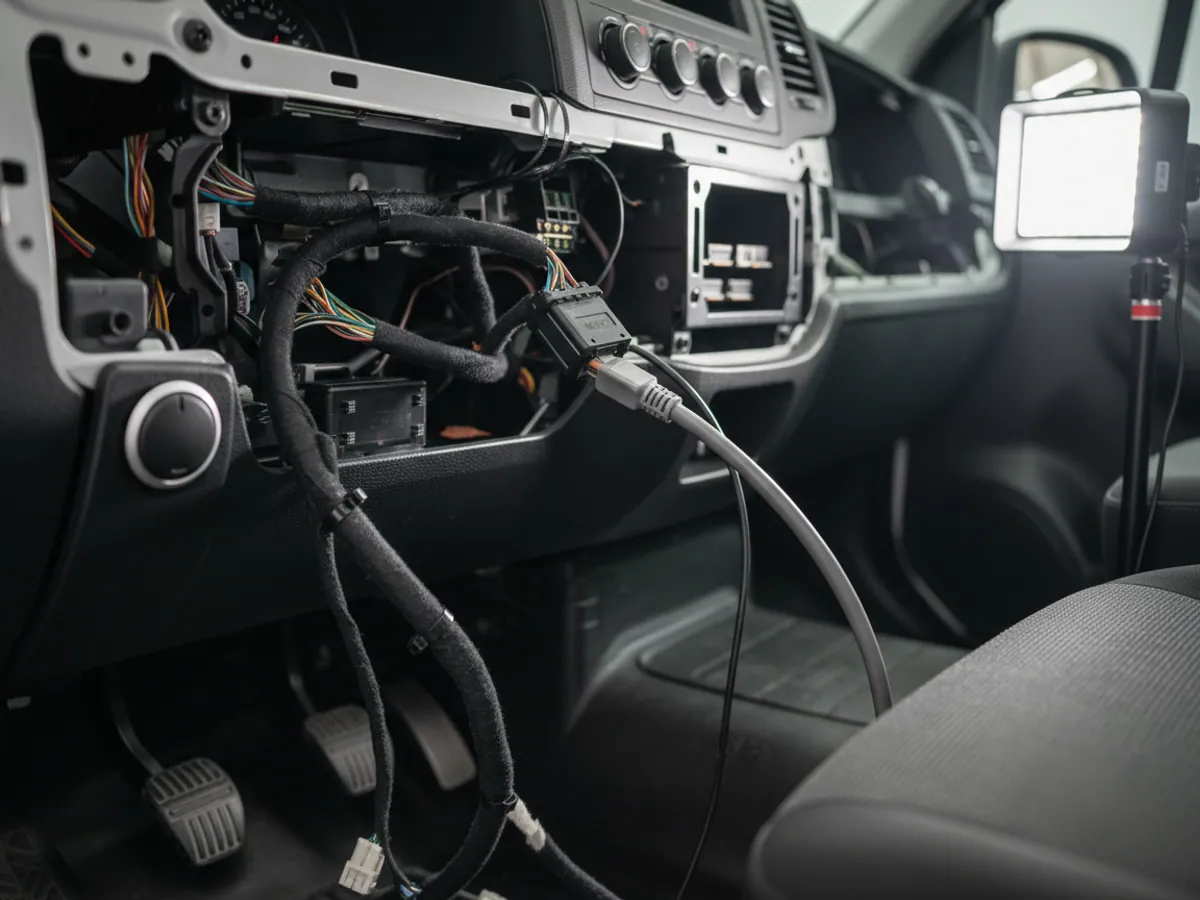
What we fit to the vehicle and what you see in Wialon
Every vehicle gets a GPS tracker — most often a Teltonika FMC130 or FMB140, and for simpler jobs a Queclink GV50. We connect the tracker to the CAN bus or OBD-II where the vehicle supports it, and add sensors where needed: a fuel level sensor in the tank, an iButton reader for the driver, Eye BLE tags on trailers and attached equipment.
The data goes to the Wialon Local platform on GPS.az servers in Azerbaijan. There it turns into things you can act on: how far the vehicle drove, how long it stood with the engine running, who was at the wheel, how much fuel it burned and when it is due for service.
You log in at go.gps.az in a browser or through the Wialon app on a phone. Different people see the same fleet, each from their own angle: the owner looks at the money, the fleet engineer at the technical condition, the dispatcher at the runs.
Who looks at what in the system
What each vehicle costs
The owner and the finance director do not need a map with dots on it. They need an answer to the question of which vehicle brings money in and which one eats it. For that, Wialon gathers all the costs per unit: fuel from the sensor, servicing and parts, fines, insurance, washing.
The result is a cost per kilometre and per engine hour for every vehicle. When it is plain that a five-year-old Ford Transit costs one and a half times as much as a new one, the decision to replace it is not made by eye. There is more on how to work out the total cost of ownership on the fleet cost accounting page.

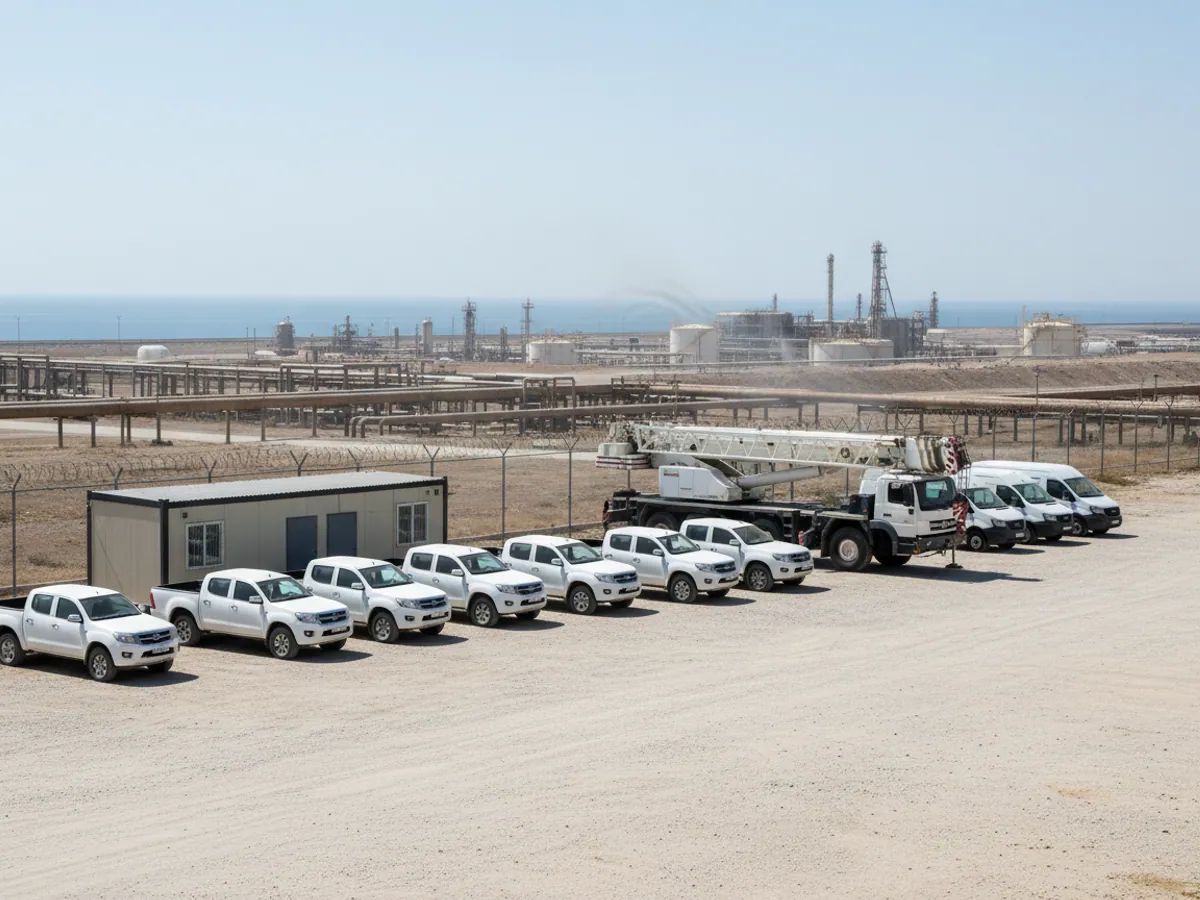
An example: a service company on the Absheron peninsula
A typical situation from the deployments we do. A contractor has 35 vehicles: Toyota Hilux and Mitsubishi L200 pickups, several vans, a couple of mobile cranes. The equipment moves between the depot in Baku and sites in Sangachal and Sumgait.
In the first month after the trackers are fitted we usually change nothing, we only collect data. And almost always the same thing comes to light:
- several pickups regularly drive at weekends and after 20:00;
- some of the vehicles spend more than half the working day parked with the engine running — in summer, for the air conditioning;
- two or three units are barely used, yet insurance, servicing and parking are paid for them.
After that the decisions are simple: assigning vehicles to shifts, a notification about trips outside the schedule, selling the surplus units. We do not promise in advance what that will come to in money — it depends on how disciplined the company is. But the manager gets the picture of who drives what and how much within 2–3 weeks.
Capabilities and metrics
Exactly what the system counts for each unit of equipment and where those figures come in useful.
Resource accounting
Mileage, engine hours, fuel consumption (1–2% margin of error with a capacitive fuel level sensor after calibration) and the running time of attached equipment — crane, mixer, pump.
Control of runs
Routes with checkpoints around town and along the M-1, M-2 and M-3 highways, including TIR haulage to Georgia, Iran and Russia.
Control of drivers
A driving style score: harsh acceleration and braking, cornering at speed, speeding. The driver is identified by an iButton key or an RFID card.
Proactive servicing
Service intervals by mileage, engine hours or the calendar, reminders in advance and a work history in the vehicle's record.
Fleet utilisation
The share of time a vehicle is actually working. It shows which units stand idle and where the fleet can be reduced without losing any of the work done.
Why the system pays for itself in some companies and not in others
The hardware and the platform are the same everywhere. The difference lies in how the company uses the data. These are the mistakes we see most often:
- Trackers fitted and nobody reads the reports. You need a specific person who opens the report on idle time and trips outside the schedule once a week and asks questions.
- No driver identification. If three people drive one vehicle and no reader is fitted, there is nobody to answer for the overspend. iButton keys and RFID cards are inexpensive and take that problem away.
- No benchmarks set. Without a consumption norm and an idle time limit the system shows figures but does not highlight the deviations.
- Fuel control over CAN on older equipment. On vehicles with no factory consumption sensor the CAN figures are imprecise or absent altogether. Honest accounting needs a fuel level sensor.
- Everything at once across the whole fleet. It is easier to start with 5–10 vehicles, get the reports and notifications right, and then roll out.
If the fleet is mixed — cars, lorries, plant and heavy equipment — engine hours and mileage are worth keeping separately. There is a page of its own about recording the work of plant and heavy equipment in engine hours: mileage and engine hours.
A map of roles: who responds to which event
The system does not manage the fleet by itself. It hands events to people. So before going live we set out with you who receives which data, who enters it and who takes the decision.
Event → owner
Each type of event is given a single owner. A trip outside the schedule and a deviation from the route go to the dispatcher. An engine fault code and a service due date go to the fleet engineer. A suspicious drop in fuel goes to the fleet engineer, copied to the finance manager. With no owner, a notification turns into noise.
Who enters what
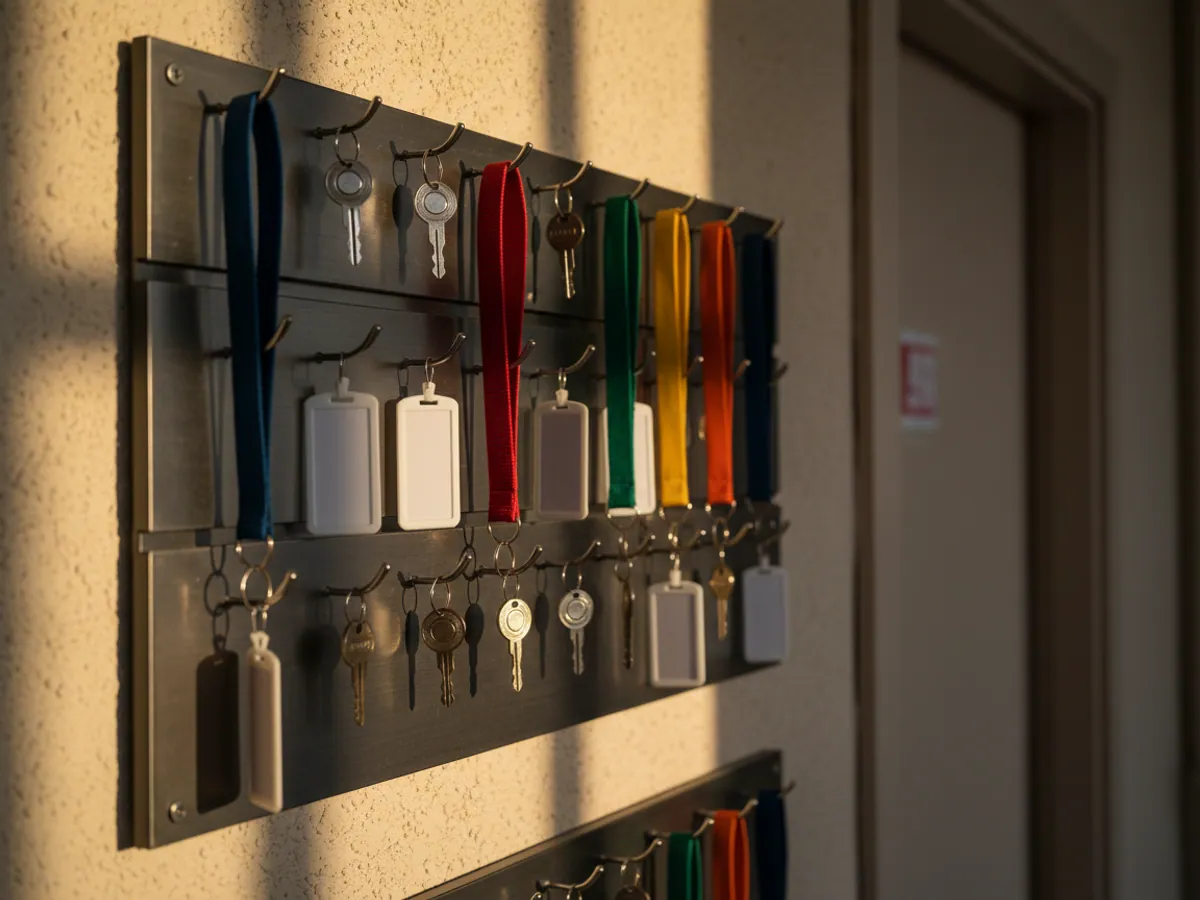
The tracker collects mileage, engine hours and fuel by itself. Repairs are entered by the mechanic, fines and insurance by the accounts department, the assignment of drivers to vehicles by the dispatcher. We write this breakdown down at the start, otherwise within a month the vehicle records will have empty lines in them.
Access rights
A branch manager sees only their own group of vehicles, head office sees the whole fleet. Drivers and outside contractors are given access selectively: to one vehicle, for the duration of a run, or only in the mobile app.
The rhythm of review
The dispatcher daily, by shift; the fleet engineer weekly, on servicing and faults; the manager monthly, on costs and utilisation. The report mailings are set up around that rhythm.
What changes in company policy
Waybills, the order assigning vehicles, the rules on using company transport outside a shift. Monitoring works when those documents refer to the system's data.
What the system does not do, and how to roll it out branch by branch
First, about the boundaries. A monitoring platform calculates, reminds and keeps a history. It does not replace an accounting system for the finance department, it does not run a parts store and it does not decide for the manager who should be disciplined or which vehicle should be sold. If such processes already live in 1C or an ERP, we link them to Wialon rather than moving them inside the monitoring system.
The second limitation is the hardware. Engine fault codes and consumption over CAN are not available on every vehicle. On older equipment you are left with GPS mileage, engine hours from the ignition and a fuel level sensor, and in the reports for such vehicles some columns will be empty.
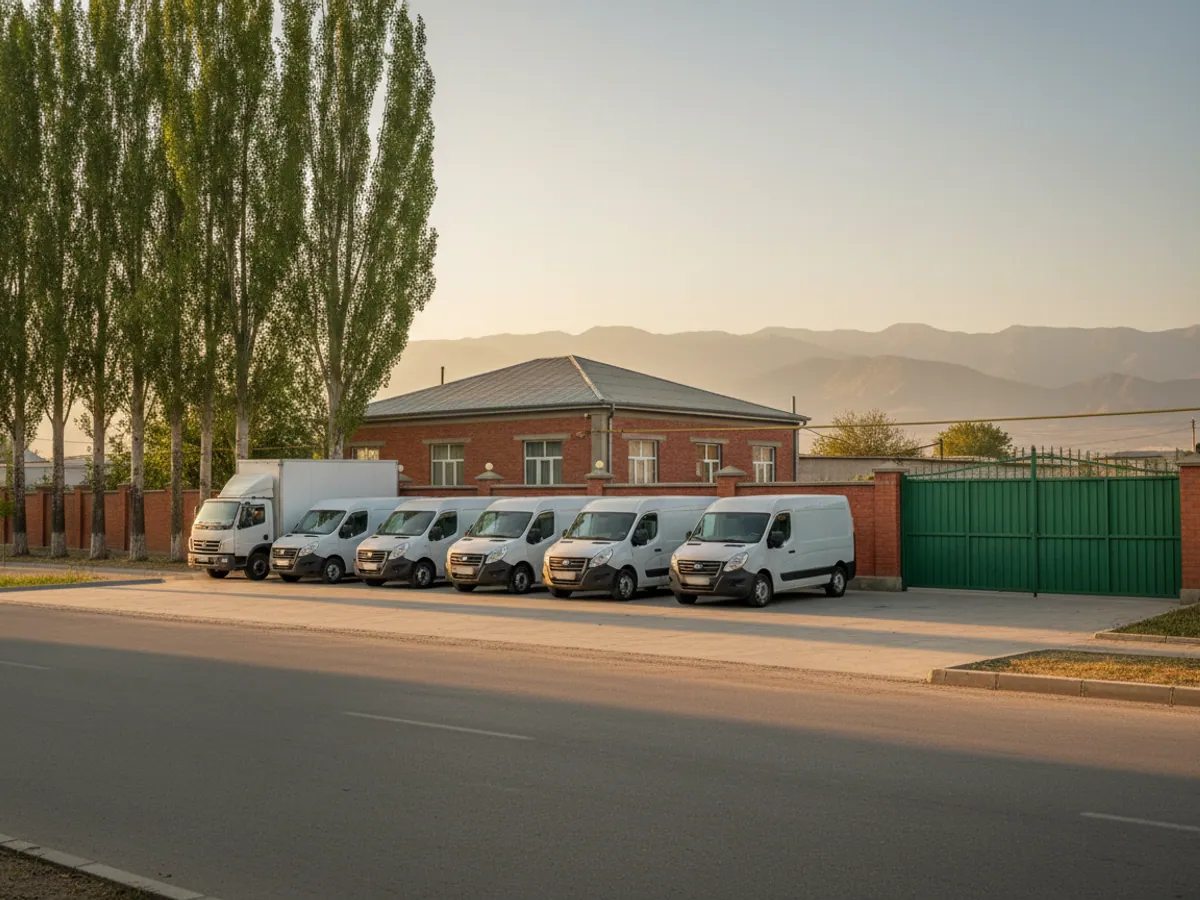
If the company has several sites — Baku, Sumgait, Ganja, sites in the regions — we go live in turn:
- A pilot branch. 5–10 vehicles where there is a manager who wants it to work. We set up the groups, notifications, reports and the map of roles, and gather the first comments.
- A template. Everything that worked in the pilot is written down: vehicle names, groups, benchmarks, notification rules, the list of recipients. That is the standard for the remaining sites.
- Rolling out. Fitting at the next branches to a schedule, so that many vehicles are not taken off the road at the same time. Each new branch gets its own group, its own responsible person and the same reports.
- The consolidated level. Once all the sites are connected, head office gets a comparison of branches in a single report.
The timing of each step depends on the number of vehicles and on how many can be put in for fitting at once. We name those dates after looking over the fleet.
What the business gets
Lower fuel costs
In our deployments, unauthorised fuel use and drains usually fall by 15–25%, provided fuel level sensors are fitted or there is reliable CAN data.
More work from the same vehicles
Once idle time and empty running are visible, fleet productivity usually rises by 10–15% without buying new equipment.
Cheaper repairs
Servicing on time and calmer driving bring repair costs down, in our experience by up to 20% a year.
Discipline
Trips outside the schedule and speeding offences become noticeably fewer within the first months — the drivers know that everything is being recorded.
Decisions on buying and selling equipment
The cost per kilometre for each vehicle shows which unit is due for replacement and which can be sold without harming the work. The argument about needing one more vehicle is settled with utilisation figures rather than with impressions.
Settling disputed cases
The track, the speed and the times are held in the archive. If a customer says the vehicle never turned up, or a driver disputes a fine, you open the history for the day in question and see how it was.

A fleet run on Excel and phone calls, or in a system
What changes in the daily work of the fleet engineer and the dispatcher once it is connected.
| Excel and phone calls | GPS.az and Wialon | |
|---|---|---|
| Where the vehicle is now | A call to the driver | Yes, on the map online |
| Work outside the schedule is visible | By chance | Yes, notification at once |
| Service intervals under control | In the fleet engineer's head | Yes, by mileage and engine hours |
| Actual fuel consumption | From receipts | Yes, from the sensor or CAN |
| Cost of each vehicle | Once a quarter | Yes, in the TCO report |
Fitting and cost
The feature becomes available once you are connected to the GPS.az platform. The cost is made up of the hardware, the fitting and a monthly subscription, which includes the SIM card traffic — the total depends on the type of vehicle and the set of sensors. We prepare an exact quote for your fleet free of charge within one working day.
- 1 Your enquiry and the list of vehicles
- 2 The quote and an agreed fitting schedule
- 3 Fitting the hardware at your own site
- 4 Setting up reports and alerts in Wialon, and training the dispatcher
Questions about “Fleet management on the GPS.az platform”
Request a call
A specialist will call back and match a solution to your fleet and your task.