Optimising fuel consumption across a fleet
A 90-day fuel reduction programme: measuring the baseline, setting norms from actual data with allowances for season and route, rules on idling, driver incentives and a comparison against the starting period. The data comes from Wialon, the CAN bus and fuel level sensors. The effect depends on the starting condition of the fleet and is counted in litres rather than promised in advance.
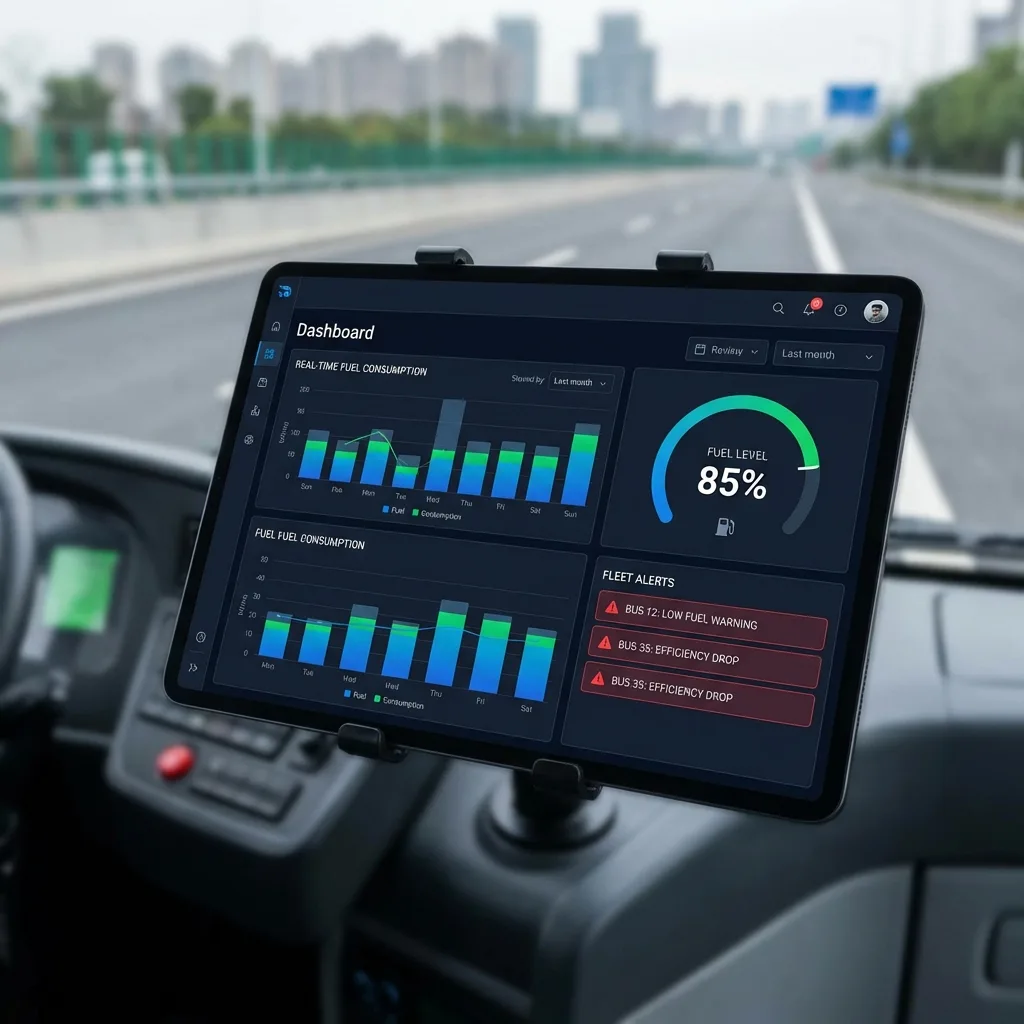
Consumption norms by model and route type, configured rules and reports in Wialon, and a comparison of the third month with the baseline brought to the same conditions. You can see how many litres were saved, on which vehicles and through what, and where there was no effect.
Excess consumption that is nobody's fault
When fuel comes up, the first thought is usually theft. But even in a fleet of honest drivers, vehicles often burn 10–20% more than they need to. The engine idles while the driver waits to be loaded. The air conditioning runs right through lunch at +40 °C. A vehicle drives to Sumgait through the centre of Baku at rush hour, when the ring road would be quicker. The tyres are underinflated, the injectors are clogged, and the consumption norm was taken from a ten-year-old data sheet.
Optimising fuel consumption means working on those causes. We measure how much fuel each vehicle actually uses and on what: movement, idling, running the attachments. Then, together with you, we introduce norms, rules and incentives, and three months later we compare the result against the baseline.
If there is theft in the fleet, it has to be dealt with separately: for that we have fuel anti-fraud. This page is about spending less while everyone is playing fair.
How the work goes, step by step
A month of baseline
Consumption per 100 km and per engine hour, idling, mileage and driving style for every vehicle.
From actual data
For each model, with allowances for season and route type: city, motorway, site.
Notifications and reviews
Long idling, engine revs, a driver rating. Outliers are examined with route and load taken into account.
A bonus for saving
Tied to the share of litres saved. Management approves the amount and the rules.
Third month against the baseline
Litres by vehicle group, adjusted for season, volume of work and the make-up of the fleet.
How the 90 days of the programme run
An illustrative example: 20 delivery vans around Baku, with the programme starting at the beginning of summer.
- We check the CAN data on every vehicle measurement
On two older vans CAN does not give consumption, so we fit a CAN adapter. No rules are introduced yet, we only measure.
- Baseline: 2 hours of idling a day baseline
About 1.2 l/h while idling. Most of it comes from waiting outside customers' premises with the air conditioning on.
- A notification for stops longer than 15 minutes rule
Idling cannot be eliminated altogether in the heat. The target is the long stops, not every halt.
- One van uses more with every driver to the mechanic
It is not about the driving. Diagnostics find a clogged air filter and low tyre pressure.
- The third month compared with the baseline result
We count litres by vehicle group with an allowance for the season. Where there was no effect, we look into why.
Five levers that genuinely move consumption
Idling
The quickest source of savings. On urban vans and buses in summer, idling accounts for 15–30% of engine running time. A rule of no more than 10 minutes, with a notification to the dispatcher, usually halves it.
Driving style
Harsh acceleration, harsh braking and high revs. The difference between a careful and an aggressive driver in the same vehicle is 10–15%. The Eco-Driving module provides the scoring.
Route and the order of stops
Surplus kilometres caused by an awkward order of deliveries and journeys through congestion. On urban routes, rebuilding the sequence cuts 5–10% of the distance.
Mechanical condition
Tyre pressure, filters, injectors, alignment. A vehicle whose consumption has risen by 12% in a month without a change of driver almost always needs a repair rather than a reprimand.
Norms and incentives
Norms based on actual data rather than the data sheet, and a bonus for consumption below the norm. Without this step, the first four produce an effect that lasts a month.
A worked example: idling in the Baku summer
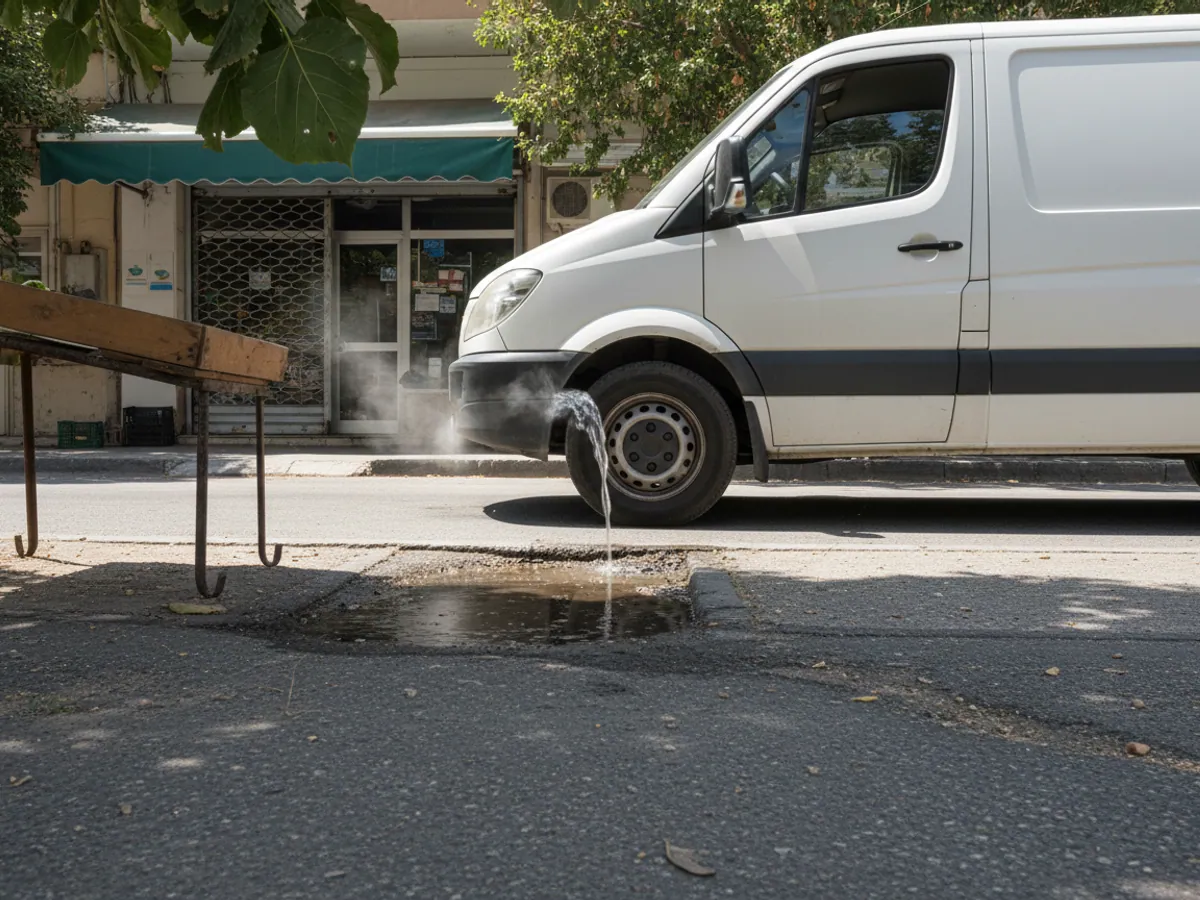
Take 20 delivery vans. Each makes 25–30 stops a day. At each one the driver spends 5–10 minutes, and in summer almost always with the engine running: without air conditioning the cab becomes unbearable within five minutes.
What the CAN bus data shows for July:
- idling — on average 2 hours a day per vehicle;
- consumption while idling — about 1.2 l/h;
- that comes to 2.4 l a day per vehicle, 48 l a day across the fleet, roughly 1,250 l over 26 working days.
Idling cannot be eliminated altogether in the heat, and demanding it is pointless: drivers will simply switch off during a check and start up again afterwards. A realistic target is switching off during long stops of more than 15 minutes and during the cooler months. That usually reduces idling by 30–50%, which is 400–600 litres a month across a fleet of 20 vehicles.
For tractor units and buses the figures are 2–3 times larger: their consumption while idling is higher and their stops are longer.
The 90-day programme
Measuring the baseline
In the first month we change nothing and only measure. If there are no trackers we fit them, and where necessary connect a CAN adapter or a fuel level sensor. For each vehicle we gather consumption per 100 km, consumption per engine hour, the share of idling, mileage and a driving style score.
The drivers are told that the system is live. Consumption usually falls a little at this stage already: people begin to watch themselves.
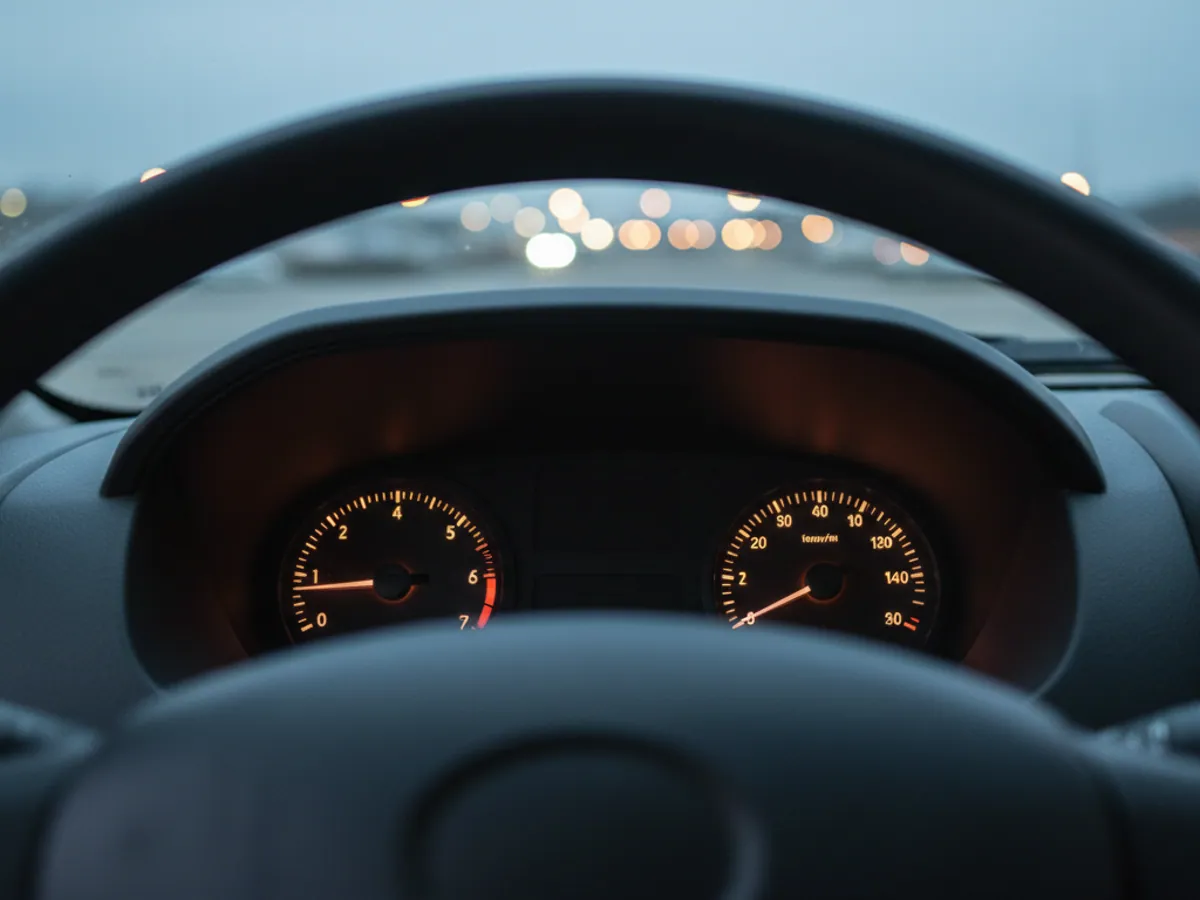


The baseline method: how we compare before and after
Length and choice of baseline
The baseline is no less than a month of ordinary working with no new rules. Holidays, repairs and atypical runs are excluded, and if the fleet works seasonally we take the same season of the previous year from the fuel records for comparison.
Season
Summer air conditioning and winter warming up change consumption more than driving style does. So we compare with an allowance for season, or compare only comparable months, and count idling separately.
Load
A laden tractor unit and an empty one use different amounts of fuel. Where there are load sensors or data on the weight carried on a run, we compare consumption with the load taken into account; where there are not, we compare like runs with like.
Drivers and routes
We compare a driver against the group on the same vehicles and routes, not against the fleet average. If a driver has changed route or vehicle, his figures before and after are compared separately.
Scope of work, boundaries and the closing review
Included
Measuring the baseline, calculating norms by model and route, setting up notifications and the driver rating, drafting the bonus rules, monthly reviews and the closing comparison against the baseline.
Not included
Repairing vehicles identified during the reviews, investigating theft (there is a separate anti-fraud service for that) and approving bonuses: we prepare a draft, the decision rests with management.
The closing review
At the end of the third month we compare litres per 100 km and per engine hour for each group of vehicles against the normalised baseline and show which changes in the volume of work, the season and the make-up of the fleet could have affected the result. The conclusions are confirmed together with your nominated contact.

On the motorway it all comes down to speed
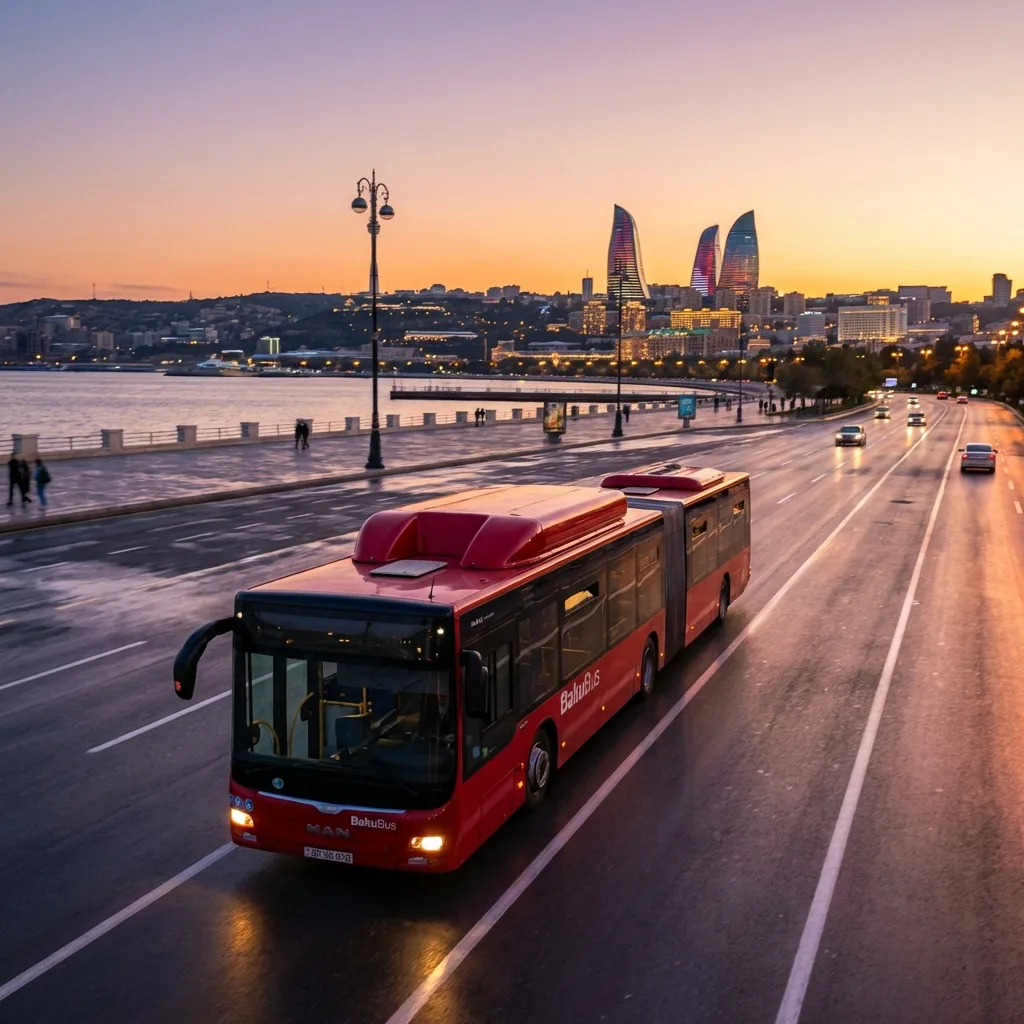
For tractor units and intercity coaches the picture is different. Their idling is noticeable at loading and at the border, but the bulk of consumption is motorway running, and there the decisive parameter is cruising speed.
On the M-2 stretch from Baku to Gazakh, a laden tractor unit travelling at 90 km/h instead of 80 typically uses 2–4 litres more per 100 km. Over a round trip that is 25–40 litres, while the gain in time is under an hour, which is often lost again in the queue for loading.
What we do for a long-haul fleet:
- build, for each driver, a distribution of motorway speed and consumption per 100 km on the same route;
- set up a notification for sustained travel above a defined threshold;
- mark the stretches with frequent acceleration and braking: the climbs near Shamakhi, the bypasses around towns;
- compare vehicles of the same model with different drivers on identical runs.
A conversation with a driver then rests on figures: last week you drove Baku to Ganja 25 minutes faster than Elchin and burned 18 litres more. Arguments like that work better than a general demand to drive more economically.

When it is the vehicle at fault, not the driver
In roughly one case in five of abnormal consumption the cause is mechanical. Typical findings:
- a clogged air filter after a summer on the dusty sites of Absheron;
- leaking or worn injectors, particularly on vehicles that have been refuelled wherever was convenient;
- low tyre pressure: half a bar down on every wheel adds several per cent to consumption;
- sticking brake mechanisms after the winter;
- a faulty thermostat, so the engine takes a long time to reach operating temperature in winter.
Monitoring does not repair a vehicle by itself, but it shows where to look. If consumption has risen by 10% in a fortnight with the same driver and the same route, the system flags it and the vehicle goes in for diagnostics before the problem turns into an expensive repair. Fault codes from the CAN bus and service reminders by mileage cover this part of the work.
The mistakes that stop the saving from happening
We have seen a good many fuel reduction projects come to nothing. The reasons are almost always the same:
Norms taken from the data sheet
The manufacturer's figure does not account for Baku traffic, the mountain stretches on the Guba to Gusar road, or the air conditioning. A driver who fails to meet it is simply working in real conditions.
One norm for every season
The consumption of the same vehicle in Guba in winter and in Baku in summer can differ by 10–15%. A seasonal allowance is needed, or everyone is an offender in summer and everyone is thrifty in winter.
Penalties only
If excess consumption is penalised while saving earns nothing, drivers learn to get around the controls rather than to drive more carefully.
No baseline to compare against
Without a before measurement there is no way to prove the effect. Six months on, nobody remembers what was being spent before, and the project is declared useless.
How we measure the result
Litres per 100 km
The main figure for vehicles that mostly drive. We calculate it for each vehicle and each driver and compare it with the norm for its group.
Litres per engine hour
For plant and heavy equipment and for buses with long stops. Together with the fuel control reports it shows where consumption goes while stationary.
Share of idling
The percentage of engine running time with the vehicle stationary. The most tangible metric for drivers and the first one to change.
Driving score
A score based on harsh manoeuvres, speeding and revs. It does not save fuel by itself, but it explains why consumption differs between drivers.
What we use on the job

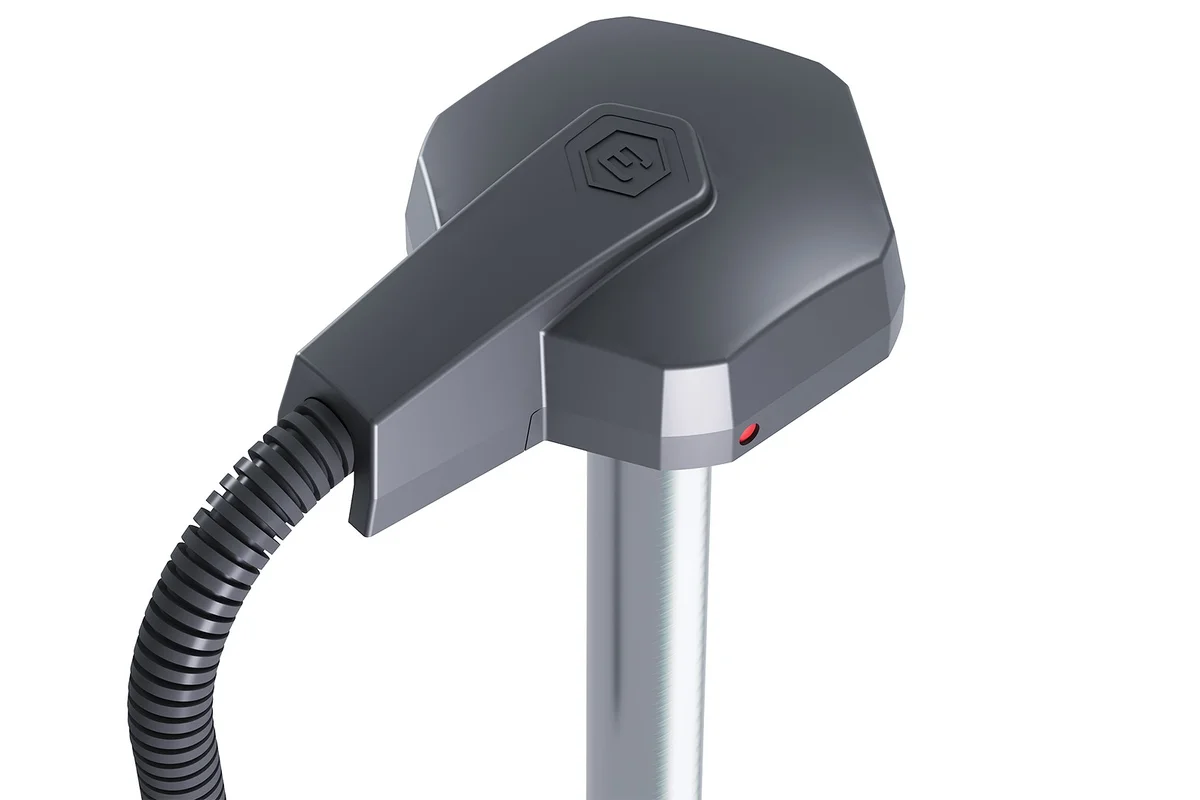

Where consumption figures come from: CAN bus or fuel level sensor
For working on consumption on modern vehicles, CAN is usually enough.
| CAN bus | Fuel level sensor | |
|---|---|---|
| Instantaneous and total consumption | Yes, if the vehicle reports it | No, calculated from the level |
| No fitting inside the tank | Yes, a contactless reader | No, the sensor sits in the tank |
| Fuel drains visible | No | Yes |
| Suits vehicles without CAN | No | Yes |
| When we choose it | A modern fleet with no drains | Older equipment and fuel drains |
Questions about “Optimising fuel consumption across a fleet”
Request a call
A specialist will call back and match a solution to your fleet and your task.
Similar scenarios
How similar jobs are done on Teltonika hardware