

Monitoring of electric cars and electric buses in Azerbaijan
Monitoring of fleets of electric cars, electric buses and light electric delivery vehicles. The dispatcher sees the battery charge and the remaining range of every vehicle, where and for how long it has been charging, and how many kilowatt-hours it uses per 100 km — and sends the vehicle that will actually get there on the long job.

Running an electric fleet without range anxiety
There are more electric vehicles in Azerbaijan every year: in taxi work, at delivery services, in company fleets. On the streets of Baku there are more and more Chinese BYD, Zeekr, Changan and other models, and electric buses are appearing on city routes. The economics of an electric vehicle are good, but only as long as it is not standing flat in the middle of a shift.
For a petrol vehicle it is enough for the dispatcher to know where it is. For an electric one, two more numbers are needed: what percentage of charge is left and how many kilometres the vehicle will really cover on it today — in the heat, with the air conditioning on, in traffic. Monitoring of electric vehicles provides those numbers for every vehicle in real time — whether a particular model reports its charge externally is covered below.
Here we have gathered what makes an electric fleet different from an ordinary one. Solutions for operators running on any kind of power are in the section on GPS vehicle monitoring.

Heat, traffic and hills: how far an electric vehicle really goes
The quoted range is 450 km. In July in Baku, at +40 °C outside with the air conditioning on full, in the traffic on Tbilisi Avenue, the real range can be 20–30% lower. In the heat the battery also charges more slowly: the cooling system limits the power on a rapid charger.
The open road has surprises of its own. The road from Baku to Gabala or Shamakhi means climbs where consumption rises several times over. Coming back downhill the vehicle recovers some energy through regeneration, but that is little comfort to a driver who set off with 40% charge. There are still fewer rapid chargers in the regions than in the capital.
The system works out each vehicle's real consumption in kWh per 100 km from its recent trips and forecasts the range from the facts rather than from the brochure. The dispatcher sees that this vehicle has 55%, which will be enough for roughly 180 km around the city, but not for a trip to Sheki and back.
The risks of running electric vehicles in a business
We see the same problems at everyone who has moved part of their fleet to electricity without monitoring.
Running flat on the road
The vehicle has stopped with a passenger or a load on board because the driver misjudged the charge. A recovery truck, a lost job, an unhappy customer — all over 5% of battery.
Battery wear
Frequent rapid charges to the upper limit in the heat and long spells parked at almost zero, judging by operating experience, wear the battery out faster. By how much depends on the model and its cooling system. The tracker shows how often this happens, if the vehicle reports that data.
Time lost at chargers
The driver stands at the station for an hour although the vehicle finished charging in 35 minutes. Or he plugged it in, charging never started, and this only came to light in the morning.
An unclear cost per kilometre
Charging at the driver's home, at the depot and at paid stations are three different prices. Without counting the kWh it is hard to tell how much cheaper an electric vehicle really is.
What the system offers EV fleets
Monitoring the state of charge (SoC)
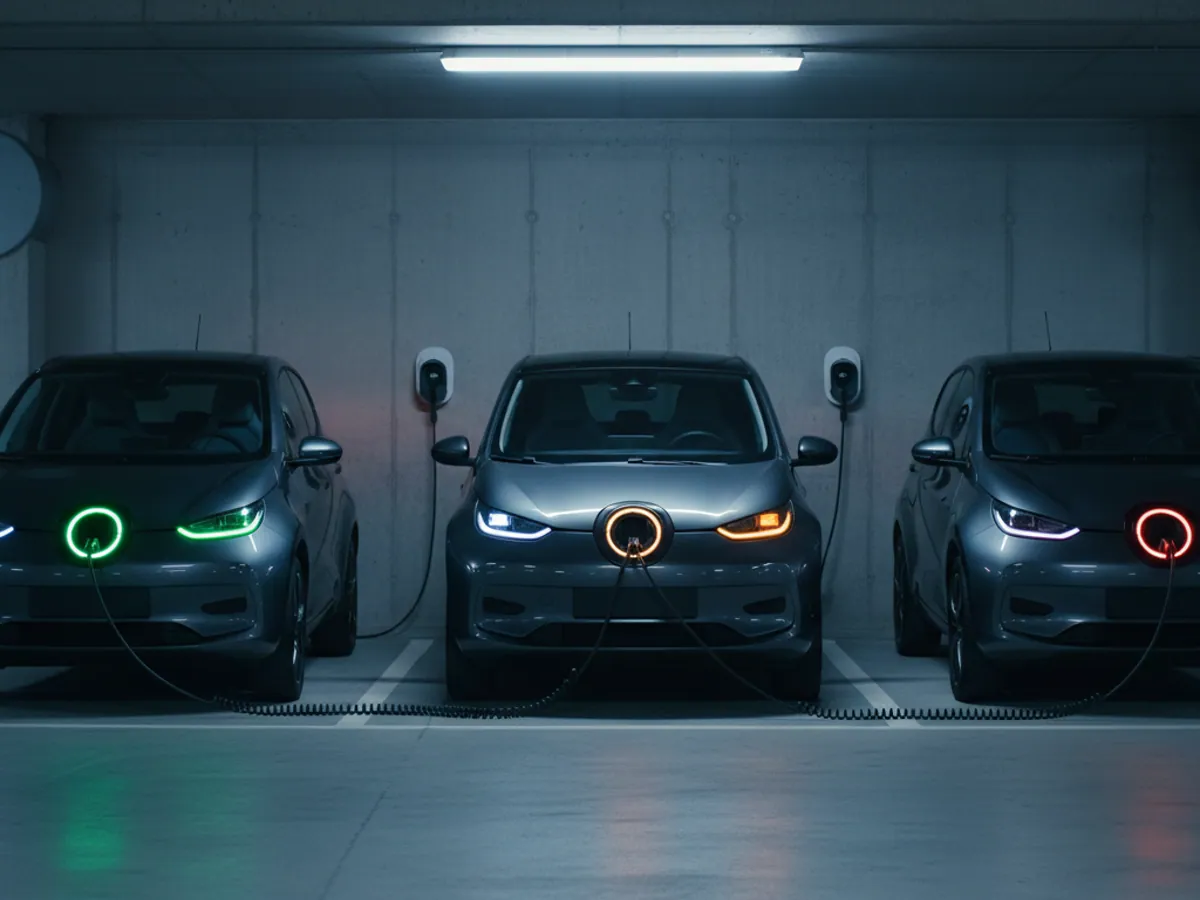
The battery charge as a percentage and a forecast of the remaining range for every vehicle on the map. The colour of the icon changes with the charge level: green, amber, red.
- A notification if the charge has fallen below a set threshold, 20% for instance, while the vehicle is far from a charger.
- A filter for who can take a 100 km job, right there in the interface.
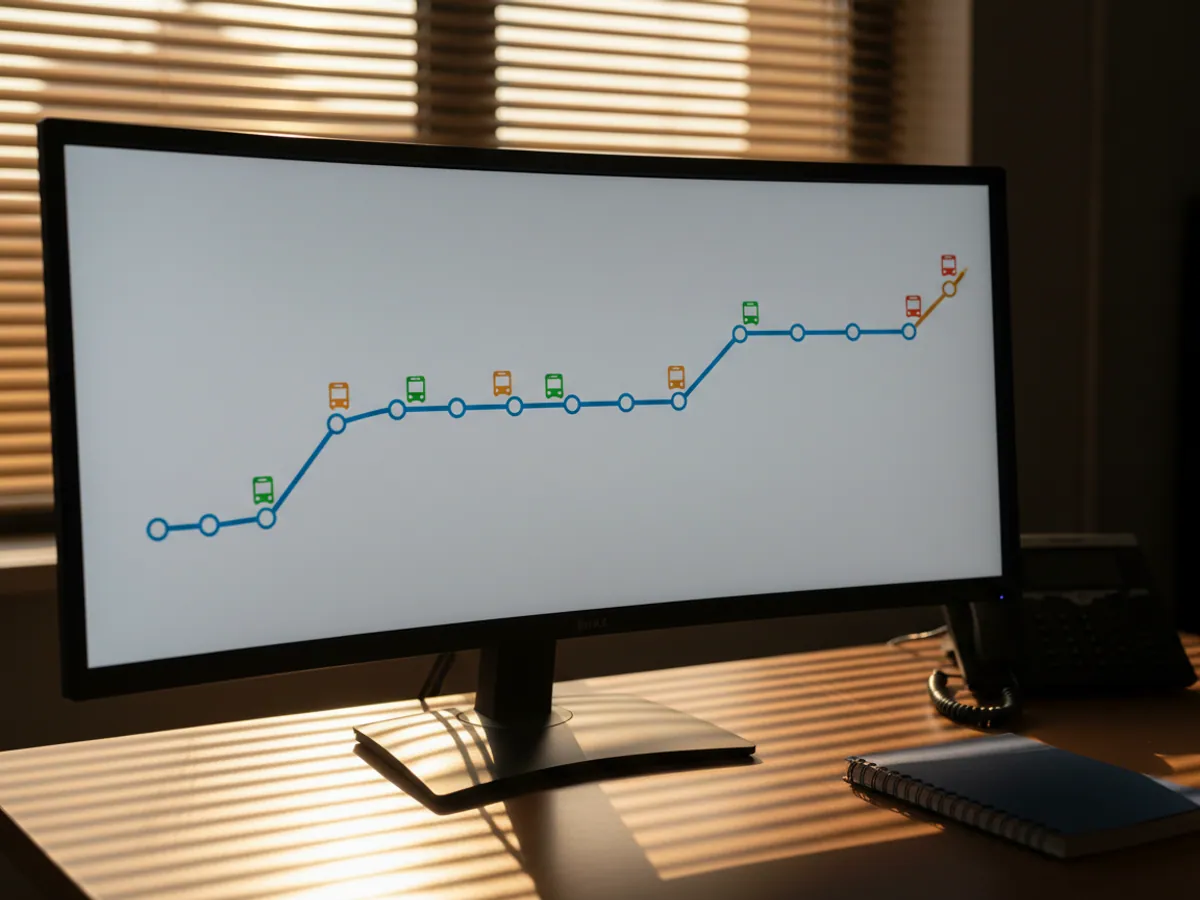
- A charge graph for the shift: it shows where and how quickly the energy went.


What data can be read from your model
This is the main question, and the honest answer is that it depends on the model and even on the production batch. An electric vehicle knows its charge and range itself; the question is whether it reports them externally in a form that can be read.
- Models with a known protocol. For many popular electric vehicles there is ready-made support in CAN adapters: charge, mileage and charging status are read contactlessly, without interfering with the wiring.
- Grey import vehicles. Some electric vehicles in Azerbaijan were not brought in through official dealers and carry firmware for the Chinese market. The protocol may differ, so before fitting the whole fleet we test one vehicle.
- If there is no data on the bus. The GPS tracker still works: position, mileage, driving style, trips. Without the battery charge, but with control over how and when the vehicle is used.
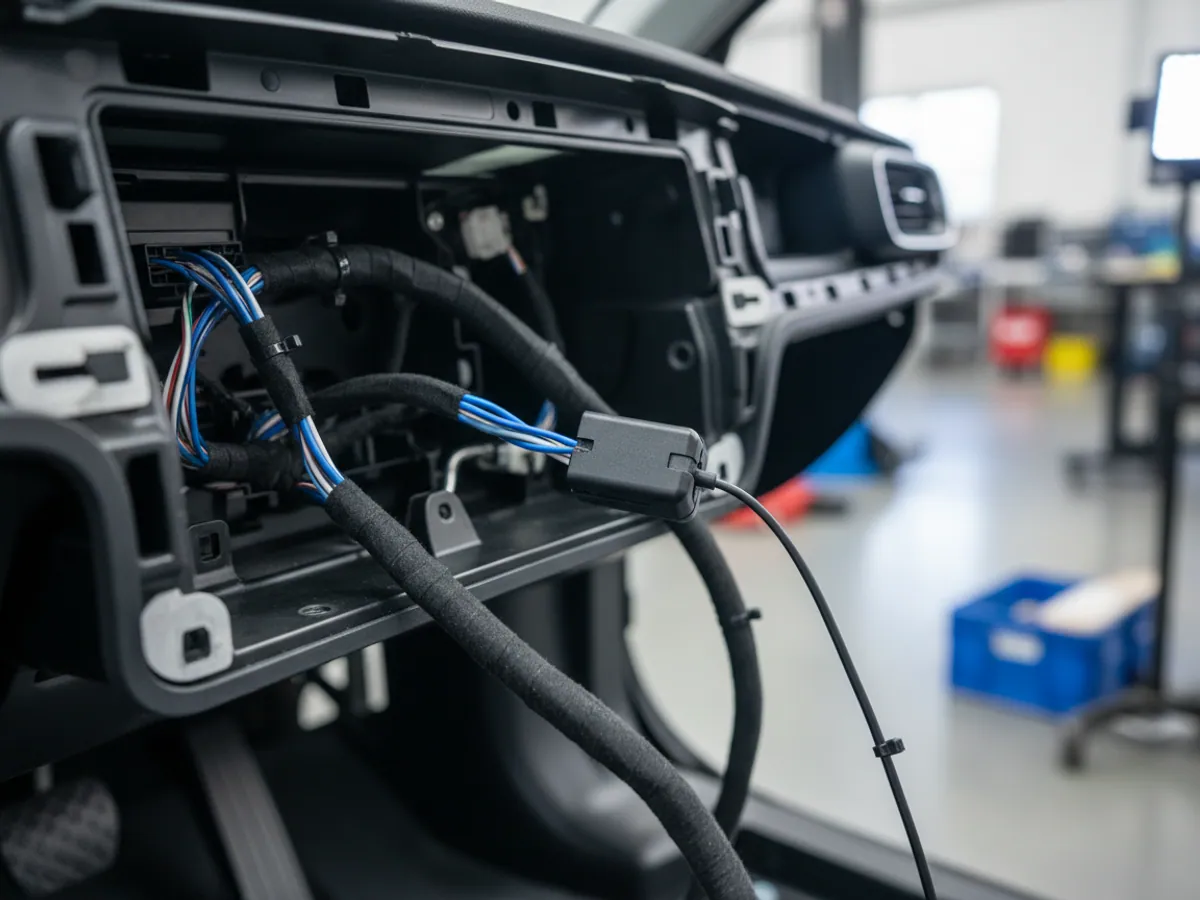
For electric vehicles with CAN we fit a Teltonika FMC130 with an adapter. Installation takes about an hour, and a contactless adapter means no cutting into the standard loom.
SOC, the charge cycle and what of it is visible per model
Before promising a dispatcher the charge of every vehicle on the map, we draw up a simple compatibility table for the fleet: model and year, firmware, and which battery parameters actually came through from the test vehicle. The rows in it are usually these:
- SOC — the charge as a percentage. Many models report it, but the value is sometimes rounded or updated less often than once a minute. We check it against the dashboard at several charge levels.
- Charging status. Not present on every model. If it is missing, we determine the start and end of a charge from the rise in SOC while parked inside a charger geofence — with a delay and without the exact power.
- kWh received. Less common. Without it we calculate the energy from the difference in SOC and the battery capacity from the specification — an estimate, not a reading from the station's meter.
- Battery temperature and SOH. Readable on only some models. If the vehicle does not report them, degradation cannot be assessed from the tracker — only indirectly, from how the range changes under the same conditions.
By a charge cycle in a report we mean this: plugging in, the charge rising, unplugging — with the place, the time and the SOC at the start and the end. It is not a full cycle in the battery manufacturer's sense. How many cycles a particular battery will withstand, the system does not know and does not forecast.
Once it is set up, the process for the dispatcher looks like this: in the morning a report shows the vehicles below the charge threshold; during the shift notifications come in about a low charge far from a charger and about a charge that never started; in the evening there is a charging summary with the columns vehicle, place, start, end, SOC before and after, kWh, type of charge. Deciding who to send where remains the dispatcher's job.

A mixed fleet: electric and combustion in one account
Almost nobody moves a whole fleet to electricity. It is usually 10–30% of the vehicles, working alongside petrol and diesel ones. They are all visible in one account, with the same reports on mileage and driving style.
The most useful report for a mixed fleet is the cost per kilometre. For a combustion vehicle that is litres at the petrol station price plus servicing; for an electric one it is kWh at the depot or station tariff plus its own servicing. When those figures stand side by side, the decision about which vehicles to replace next is taken on the facts. Our approach to fleet cost accounting is on the page about fleet costs.
Electric buses on city routes are monitored by the same rules as diesel buses, plus charge and charging at the depot. There is more about buses on the page about public transport monitoring.
How we connect an electric fleet
A test vehicle
We fit a tracker with a CAN adapter to one vehicle of each model and spend a week checking what data comes through and whether it matches the dashboard.
Setting up the calculations
We enter the battery capacity, the electricity tariffs by charging location and the low charge thresholds. The range forecast is calibrated against the real trips of the first weeks.
Charger geofences
We mark your depot chargers and the stations the drivers use. That shows where a vehicle charged and which tariff to apply.
The whole fleet and the reports
We equip the remaining vehicles and set up the reports: charge by shift, charging sessions, kWh consumption, cost per kilometre.
What we need from the fleet and when the pilot is accepted
A list of models with their years of manufacture, one vehicle of each model for a week of testing, the addresses of the depot chargers and the tariffs. The criteria are agreed in advance: for example, the SOC from the tracker matches the dashboard within a reasonable margin, every charge over the week appears in the report, and the range forecast has been checked against real shifts.
Mistakes that eat up the benefit of an electric vehicle
Trusting the quoted range
The brochure figure was obtained in ideal conditions. A shift in the heat has to be planned around the real consumption of the particular vehicle.
Charging only rapidly and only to 100%
It is convenient, but it ages the battery faster. Unless the manufacturer recommends otherwise, slow overnight charging at the depot to 80–90% is a good baseline, with rapid charging when it is genuinely needed.
Not accounting for charging at the driver's home
If the driver charges the vehicle at home and the company reimburses him, then without kWh figures from the tracker the amounts are plucked out of the air.
Buying a model without checking the protocol
If the battery charge is critical to the work, check whether it can be read from that model before buying a batch rather than afterwards.
Frequently asked questions (FAQ)
What is used in this sector
What we do end to end
Wialon modules for this sector
How it is used in this industry
Case studies from “Fleets & Transportation Companies”


Thinking of rolling out GPS monitoring in “Electric vehicles”?
Send us an enquiry and we will price it up for your fleet and pick the hardware for this sector: fleets & transportation companies.
- 1 We pin down the task
A specialist calls back and asks about the vehicles, how many there are and what you need to keep an eye on.
- 2 We put a solution together
We propose the hardware and the features, and set out the one-off and the monthly cost separately.
- 3 We agree the fitting
At your yard or at ours, on a schedule that keeps the vehicles working.
Request a call
A specialist will call back and match a solution to your fleet and your task.