
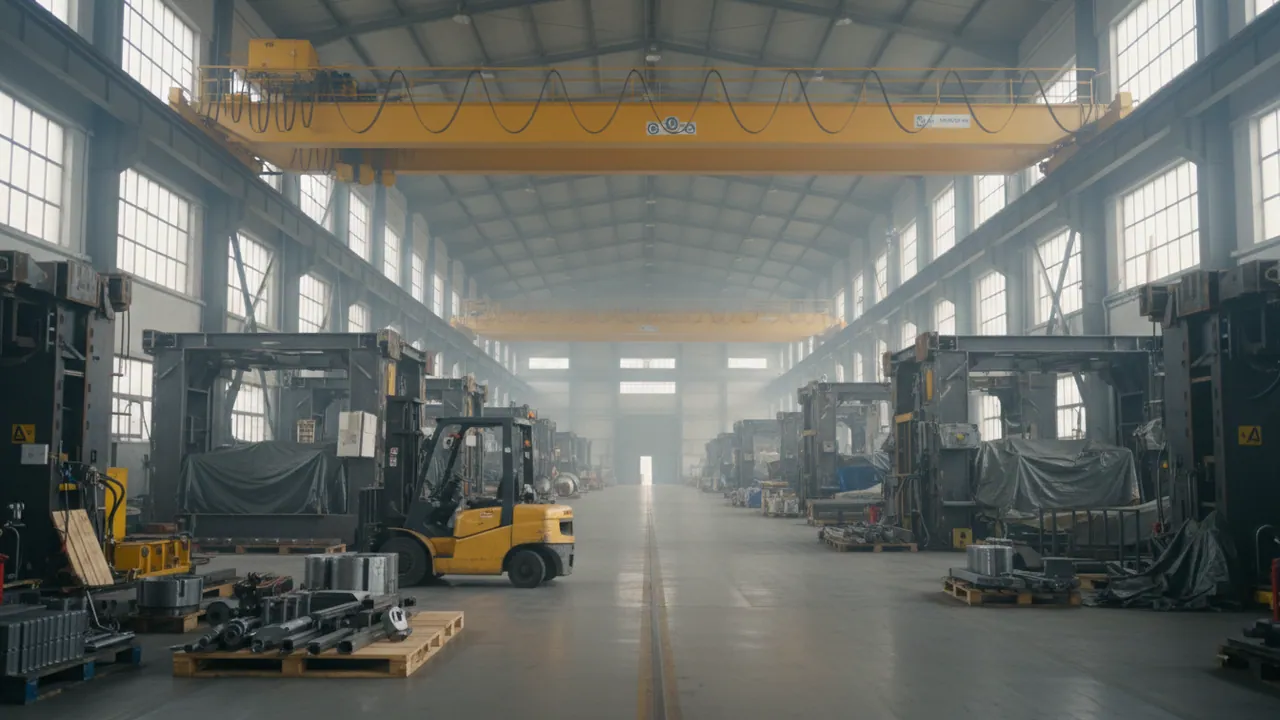
GPS monitoring for engineering and machine-building plants
Records of the work of forklifts, supply tractors and finished-goods delivery vehicles for assembly and machining plants — in the industrial parks of Sumgait, Pirallahi and Balakhani, and in Ganja and Nakhchivan.
We show how many hours a forklift really spends moving pallets, who is at the controls, where the vehicle with the components is standing, and why a part reached the line an hour late.
It is not the machine tools that stop the line
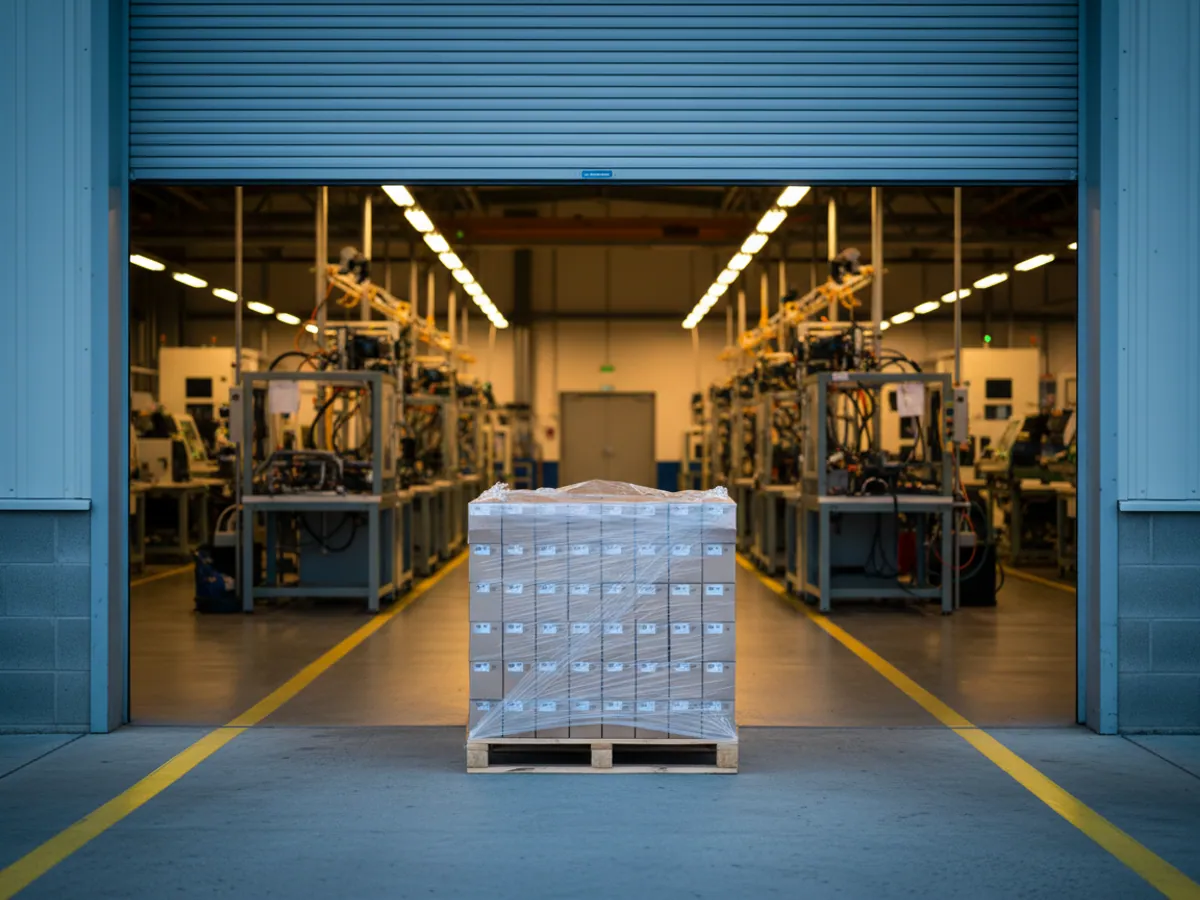
At an assembly or machining plant the line usually stands idle for reasons other than a breakdown. What stops it is something that has not arrived: a pallet of fasteners stuck at the warehouse gate, a forklift that has gone off to another area, a lorry with components queuing at the checkpoint.
GPS monitoring for engineering plants covers exactly that part — the movement around the machine tools. A tracker on a forklift shows engine hours under load and idle time, a tracker on a supply lorry shows where it is and when it will be at the gate, and a driver card shows who was on the machine at a given minute.
We are not selling a digital twin of your plant. We fit equipment to the machines and set up Wialon and the reports that a shop supervisor will open in the morning and understand in two minutes. A general overview of solutions for manufacturing is gathered on the GPS monitoring for industrial enterprises page.
Where the hours go: one shift at a plant
This is the typical picture we see in the first two weeks after trackers are fitted to forklifts.
A fleet of 14 forklift trucks, two shifts. According to the log all 14 are in use. According to the tracker data: four machines spend less than two hours a shift lifting a load, one stands at the charger all day, and on two more the engine hours mount up while the load sensor on the forks stays silent — the drivers are running empty between shops because they are looking for a pallet to pick up.
From this the plant draws two conclusions of its own. First: there are enough forklifts, what is lacking is order in the movement requests. Second: there is no need to extend the hire of another three machines for the next quarter.
That kind of analysis is only possible when the engine hours are split into engine running, machine moving and forks under load. For this we connect a pressure sensor in the lift hydraulics or a limit switch on the mast to the tracker — more on how the counting works on the engine hour records for plant and heavy equipment page.
The hidden losses of an engineering plant
The accounts department sees these losses as overheads. Monitoring breaks them down by particular machines, shifts and people:
The line waiting for components
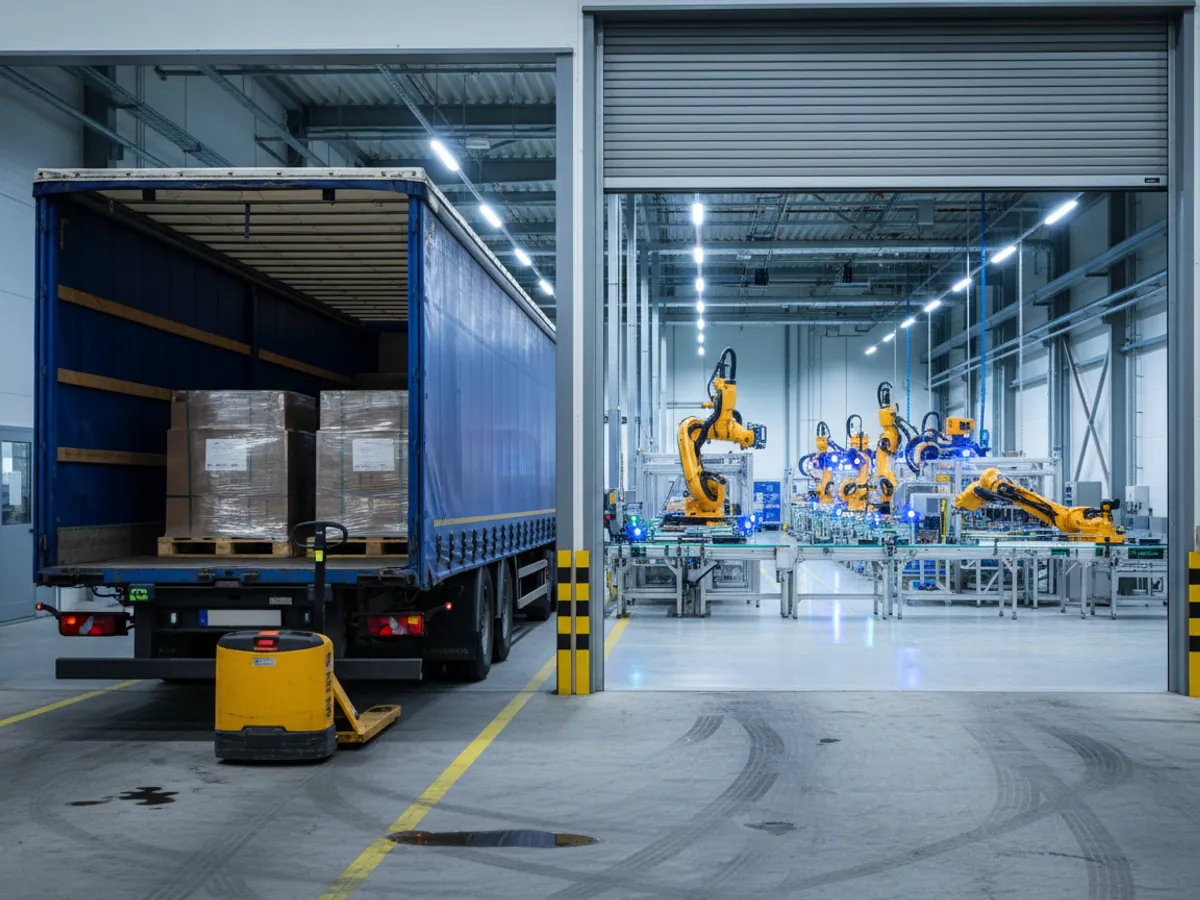
The supplier's lorry arrived but waited an hour and a half to be unloaded, because the forklift was at the other end of the site. Without trackers such waits never appear in any report.
Surplus hired equipment
The plant hires forklifts with something in reserve. When the real utilisation by the hour is visible, it becomes clear which of the reserve machines are genuinely needed on peak shifts and which can go back.
Impacts and damage with nobody responsible
A bent mast, a knocked-over rack, a cracked pallet of castings. The impact sensor in the tracker records the time, the place and the driver card — the investigation takes minutes.
Leaving through the checkpoint
A works van or lorry leaves the site for somewhere other than what is written on the pass. Geofences and the stop report show where the vehicle actually went.
What we fit to a plant's equipment
The set of equipment depends on the type of machine, not on a package. For engineering sites it usually works out like this:
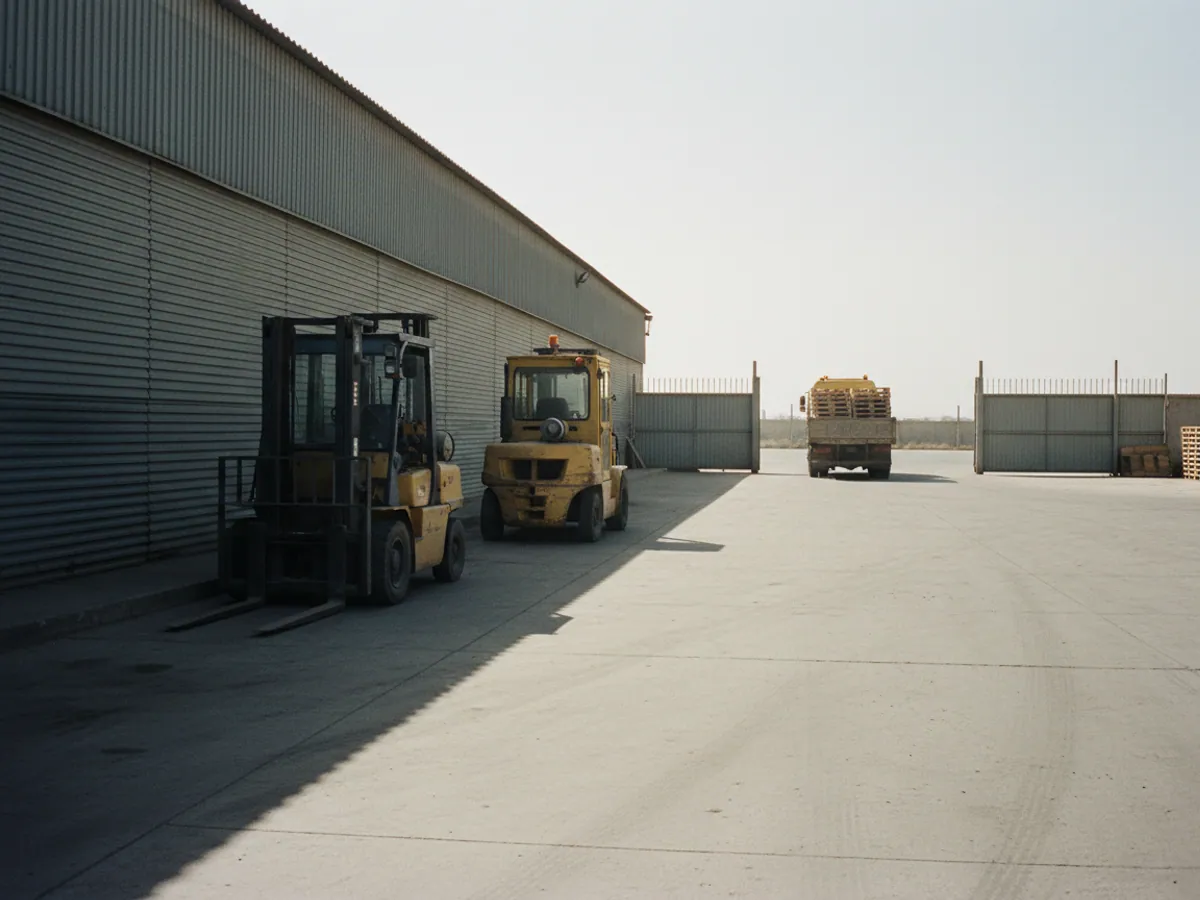
- Electric forklifts and stackers — a compact Teltonika tracker powered from the traction battery through a converter, a lift hydraulics sensor and a driver card reader.
- Diesel and gas forklifts — the same plus a fuel level sensor, if the machines are yours and are filled from the works tank.
- Supply tractors and lorries — a Teltonika FMC130 or FMB140 reading CAN: mileage, consumption, engine faults.
- Works delivery vehicles — a tracker with a loaded/unloaded status button, or the driver's mobile app.
Authorisation to use the equipment is by employee card. Without a card presented the forklift does not start, and the shift report carries a name rather than driver No. 7. The readers and cards are described in the driver identification section.
An honest limitation: GPS does not work inside a metal-framed shop. The tracker keeps counting engine hours and load, and determines the zone — assembly shop, blank store, dispatch — from Teltonika EYE Beacon BLE beacons. The accuracy is at the level of a zone or a bay, not a metre.
How this works in different areas
Fleet utilisation by the hour
For each forklift a shift timeline is built: work with a load, moving empty, standing with the power on, charging. In the evening the supervisor sees not a general utilisation figure but the particular gaps — from 10:40 to 12:15 the machine stood by the blank store.
- Speeding inside the building — a notification to the shift supervisor and an entry in the report
- Impacts from the accelerometer, with a threshold matched to your equipment
- A counter to the next scheduled service based on engine hours rather than the calendar
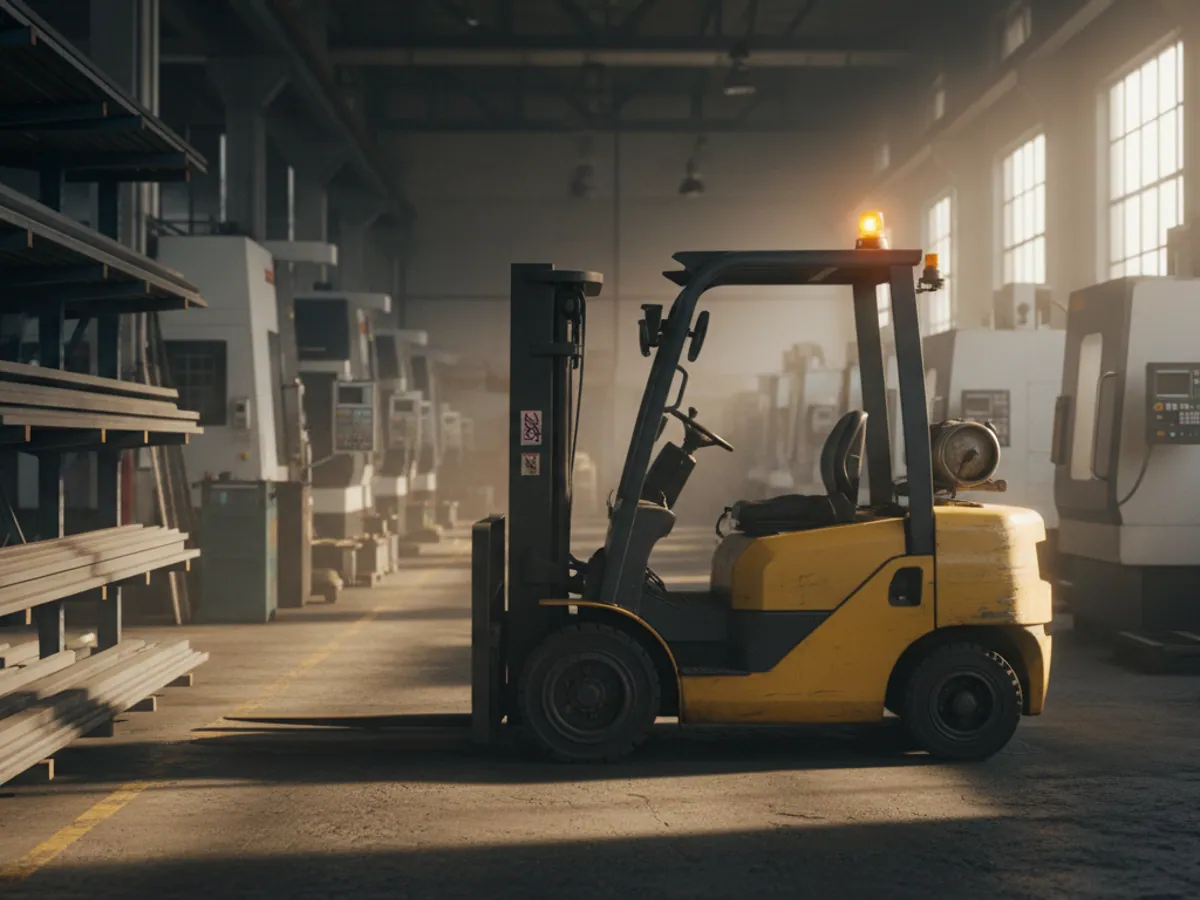
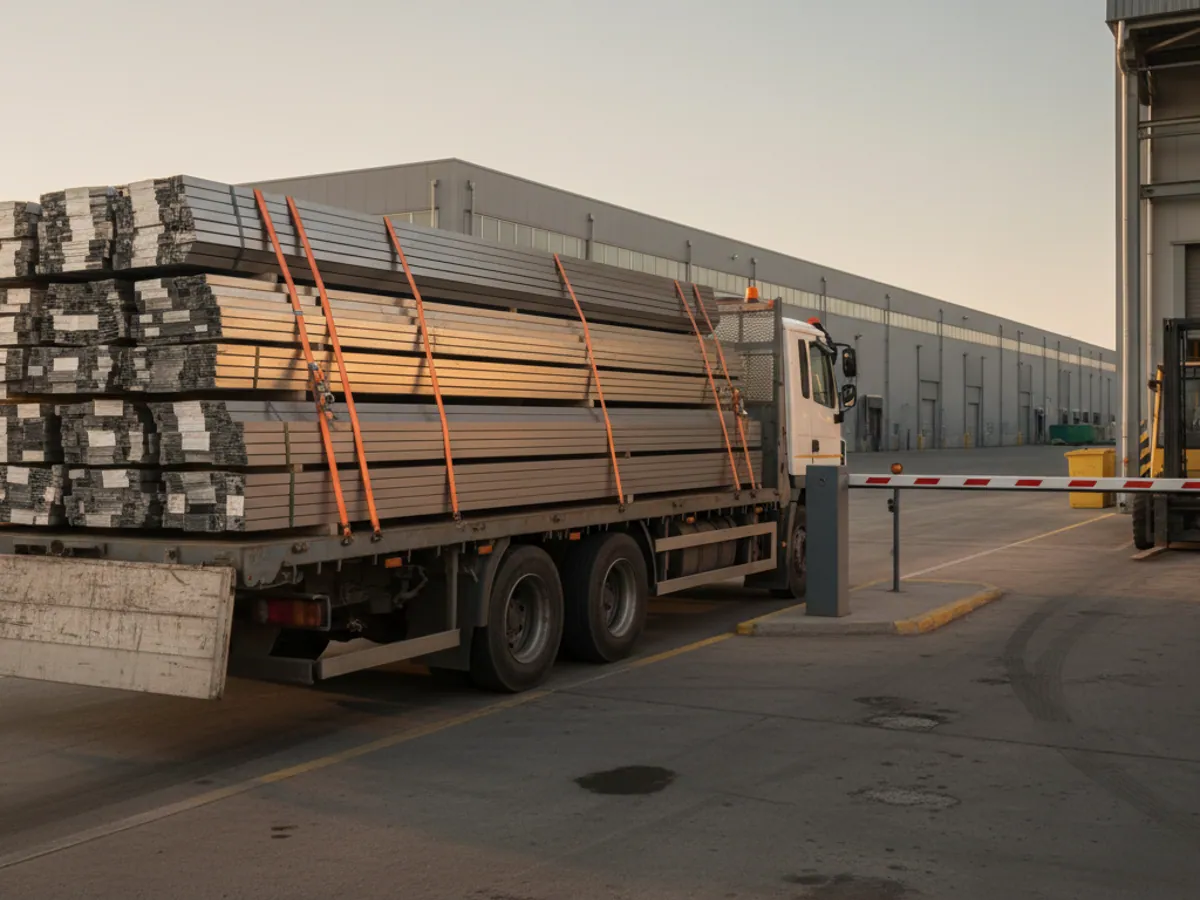
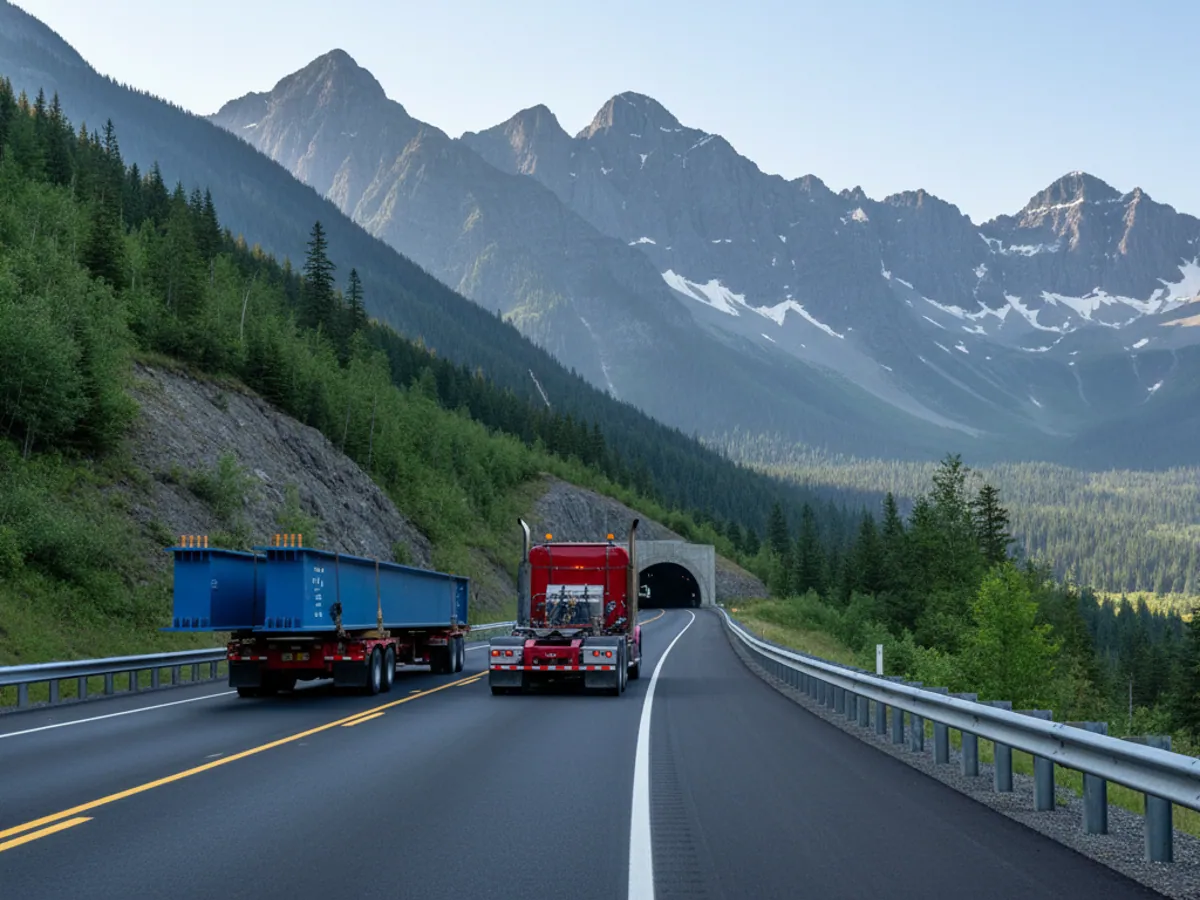
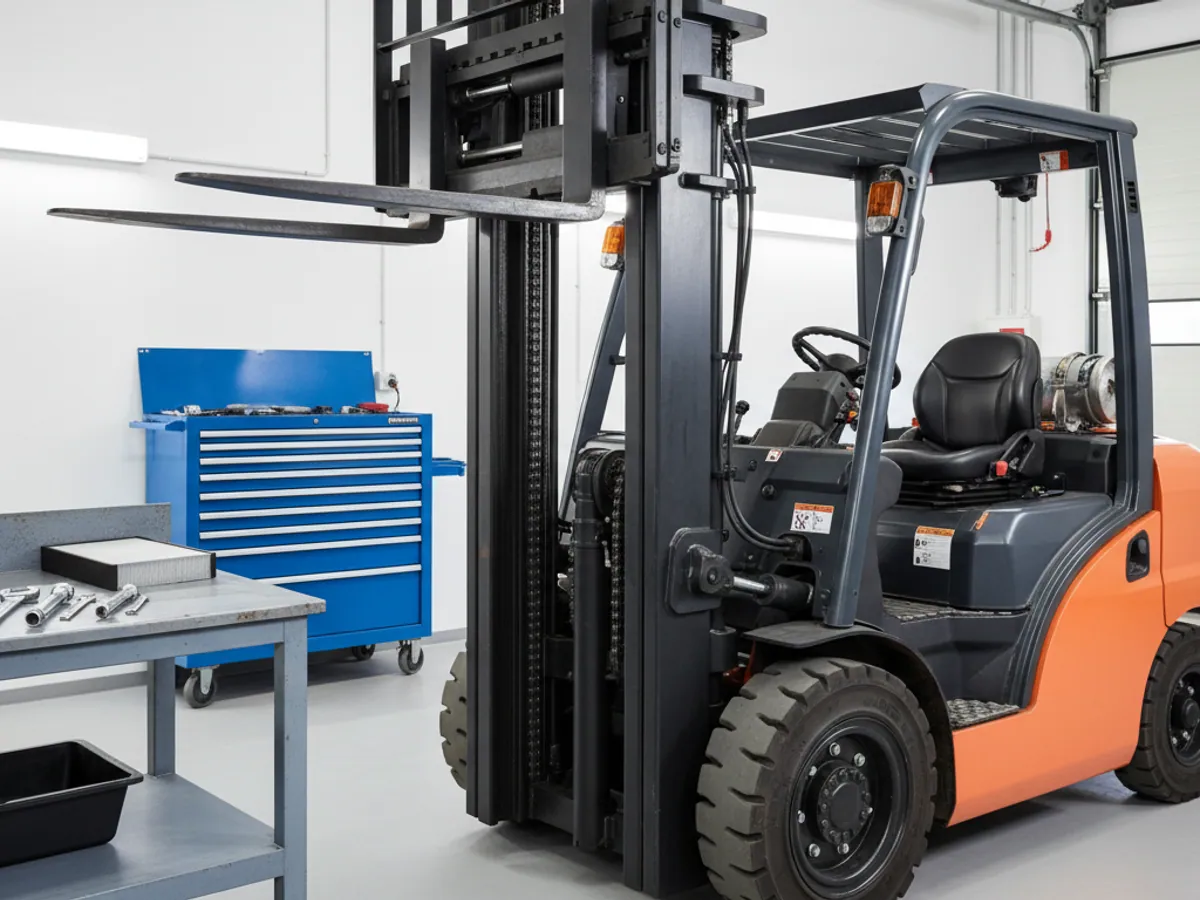
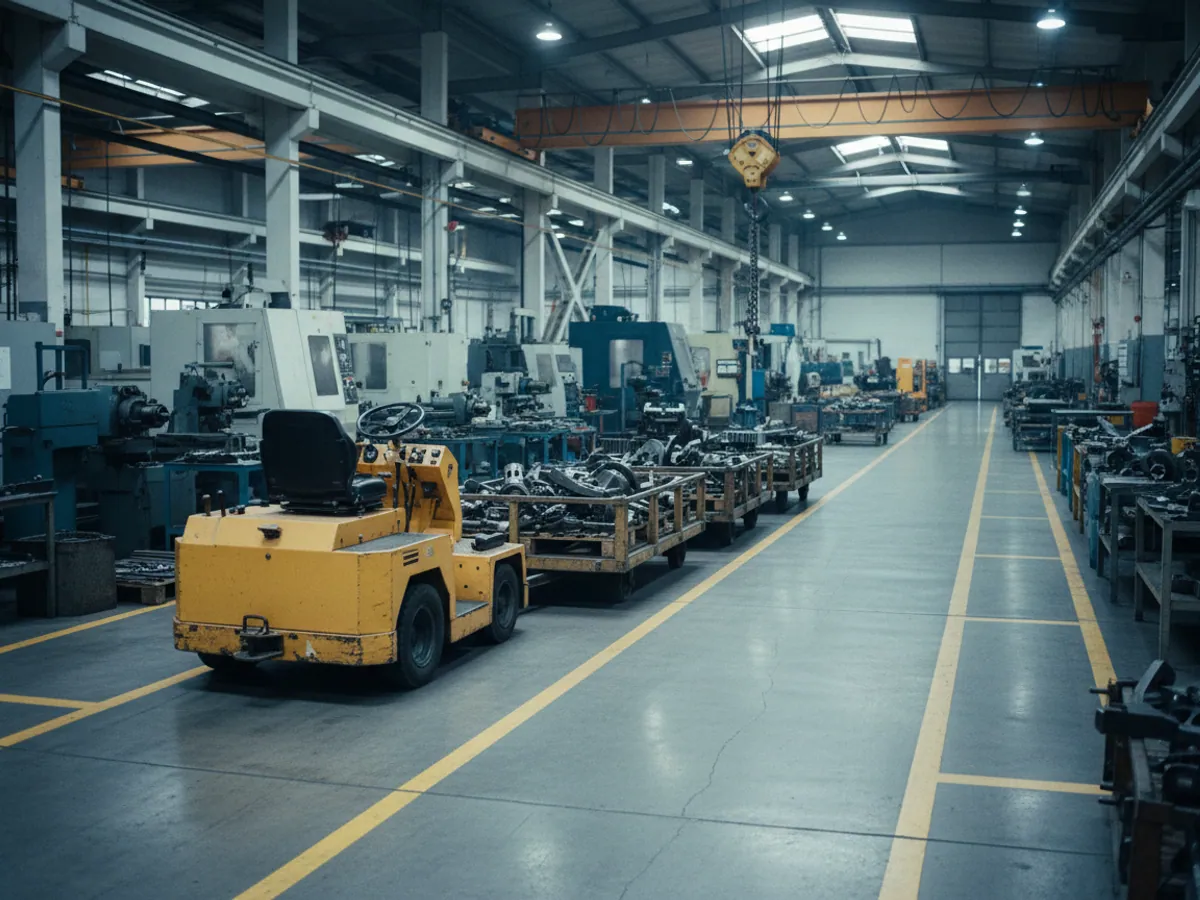
Internal movements and finished goods: where the line with MES runs
At an engineering plant material goes round in a circle: component store — machining area — assembly — painting — finished goods store — dispatch. Some of these movements are made by forklifts and tugs with trailers, some by cranes, which we do not track.
Monitoring answers for the equipment: which machine, with which operator, in which zone, how long it worked with a load and how long it waited. If BLE beacons are mounted around the areas, you can see how many times in a shift the forklift travelled between assembly and the store.
What exactly it was carrying the system does not know. Which batch of parts went to assembly, which product is finished and passed by quality control, which order has been dispatched — that is MES, ERP or warehouse accounting data. Telematics neither replaces it nor argues with it.
The two worlds can be linked through integration: a movement task from MES or the warehouse gets its start and finish times from the tracker data, and a finished goods dispatch gets the track of the run to the customer. This needs a shared identifier (the vehicle, task or delivery note number) and an administrator of your system to set up the exchange on their side. Without that, both systems run in parallel and people do the reconciliation.
Rollout stages at a plant
1. Walking the site
The engineer walks the shops and warehouses with the head of logistics. We note where BLE beacons are needed, which machines are electric, where the charging stations are, and how the checkpoints and the weighbridge are arranged.
2. A pilot on 3–5 machines
We fit trackers to the busiest forklifts and one lorry. For two weeks we gather data and tune the thresholds: what counts as an impact, what counts as idle time, what speed is acceptable inside the building.
3. Fitting across the whole fleet
We work between shifts or at the weekend so as not to hold up dispatch. A forklift is equipped in 1–2 hours, a lorry with CAN and a fuel sensor in half a day.
4. Reports by role
The shift supervisor gets a timeline for his machines. The chief engineer gets engine hours and servicing. The production director gets a weekly summary of fleet utilisation on a single page.
5. Linking to the accounting system
If wanted, we pass engine hours and trips into 1C or SAP through an API. This is a separate project and it makes sense to start it after two or three months of working with the basic reports.
The pilot: what we need from the plant and how to sign it off
What is needed before the start: a site plan with the shops, warehouses and checkpoints; a list of the pilot machines with their power type and model; a list of operators to issue cards to; the existing procedure for movement requests; and a responsible supervisor who will look at the reports every day.
The sign-off criteria we usually agree:
- the shift timeline for each pilot machine is split into work with a load, moving empty and idle time;
- every impact above the threshold is tied to an operator, and false triggers have been removed by tuning;
- where beacons are fitted, the machine is placed in the correct zone on the check runs;
- waiting time for suppliers to be unloaded at the checkpoint and the warehouse is counted automatically.
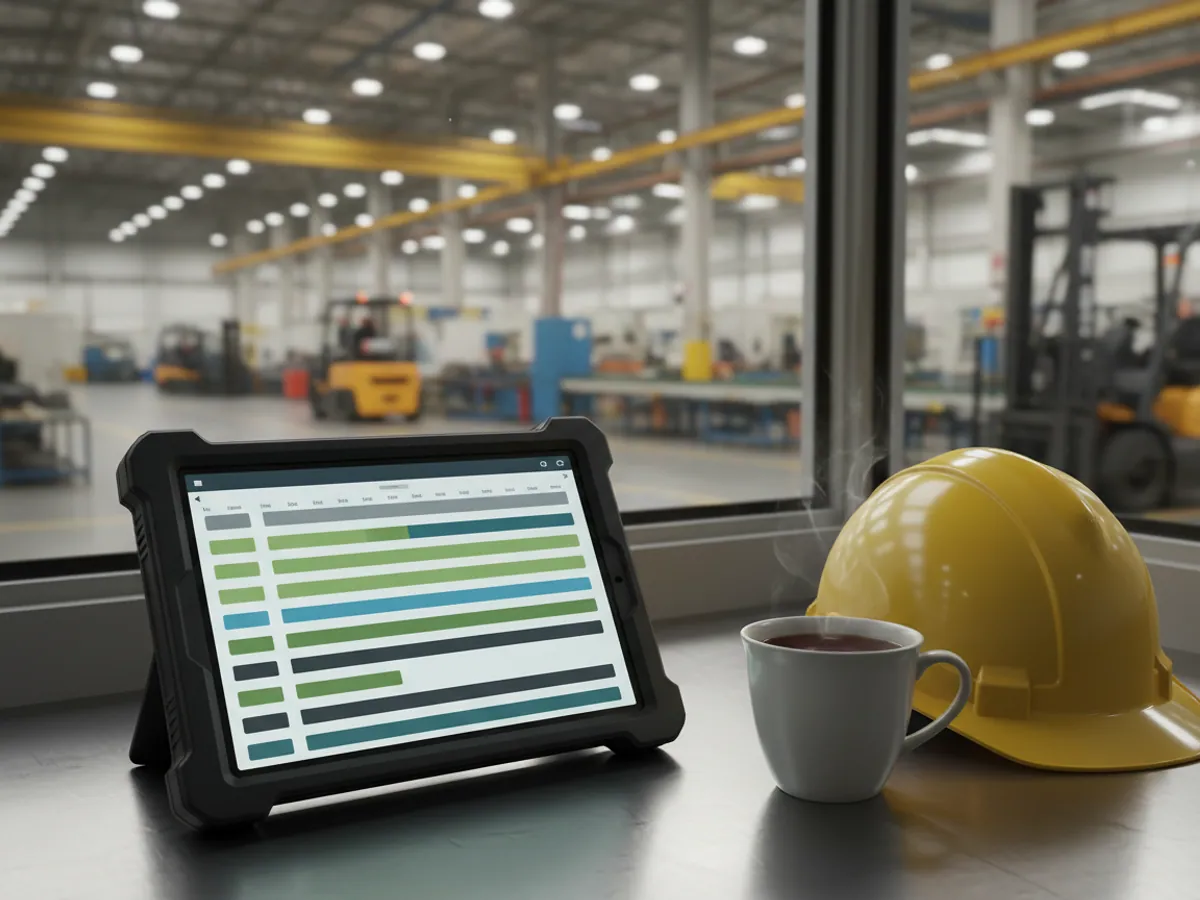
An example of the supervisor's report: for each forklift per shift — operator, hours with and without a load, idle time, impacts with their time and zone, and engine hours remaining until the next service. For management, a weekly summary of fleet utilisation on a single page.
How to work out the payback on your own figures
We do not promise a percentage saving in advance — it depends on how your internal logistics is organised. But it is convenient to count under three headings.
Equipment hire. If after two months of data it turns out that 2 of your 12 hired forklifts are loaded for less than a third of a shift, returning those two machines usually covers the cost of monitoring the whole fleet.
Repairs after impacts. When a driver knows that an impact is recorded together with his card, the number of damaged masts and racks that appeared from nowhere drops. In practice, several times over in the first months.
Waiting on the line. The most expensive heading, and the hardest to turn into money. Take the cost of an hour of assembly line downtime and multiply it by the hours of waiting for components that the report shows. Usually the payback question closes itself after that.
For equipment the plant services itself, the service planning module is useful — it adds the saving on unplanned repairs to the calculation.
Common mistakes we see
Fitting a tracker without a load sensor
You then have engine hours, but no way of telling whether the forklift was carrying a load or running empty. The commonest reason for disappointment with a system.
Not introducing driver cards
Without identification an impact or a speeding event belongs to the machine rather than to a person. Arguing with the crew in that case is pointless.
Expecting metre accuracy in the shop
For recording work, the zone-level accuracy of BLE beacons is enough. Metre-level positioning is a separate and expensive system that only a handful of plants need.
Opening every report to everyone
A supervisor who receives forty reports opens none of them. We start with two or three and add more on request.
Questions from engineering plants
What is used in this sector
What we do end to end
Wialon modules for this sector
How it is used in this industry
Case studies from “Manufacturing Plants”

Thinking of rolling out GPS monitoring in “Machinery manufacturing”?
Send us an enquiry and we will price it up for your fleet and pick the hardware for this sector: manufacturing plants.
- 1 We pin down the task
A specialist calls back and asks about the vehicles, how many there are and what you need to keep an eye on.
- 2 We put a solution together
We propose the hardware and the features, and set out the one-off and the monthly cost separately.
- 3 We agree the fitting
At your yard or at ours, on a schedule that keeps the vehicles working.
Request a call
A specialist will call back and match a solution to your fleet and your task.